Figures & data
Figure 1. Respiratory chain Complex I of mitochondria is successfully labelled by its 30 kDa subunit (CI-GFP). (A) Localization of CI-GFP in mitochondria. HeLa cells were stable transfected with CI-GFP resulting in fluorescence labelled mitochondria (AA). The same set of cells was stained MitroTracker Red CMXRos (Molecular Probes) (AB). (AC) Merging of images AA and AB. The fluorescent signals are fully co-distributed, revealing a mitochondrial localization of CI-GFP. Bar: 8 µm. (B) Intact expression of the fusion proteins CI-GFP and GFP-hFis in transfected cell lines. Total cell lysate of HeLa cells transfected with CI-GFP, GFP-hFis and GFP was analysed by Western blot with anti-GFP (Clontech). CI-GFP shows an expected size of 52 kDa (lane 1), hFis-GFP has 40 kDa (lane 2) and GFP has 24 kDa according to the calculated mass (lane 3). No free GFP is detected in lane 1 and 2. (C) CI-RFP localizes differently from the outer membrane protein GFP-Tom7 in mitochondria in cells co-transfected with CI-RFP and GFP-Tom7. Bar: 1 µm. (D) Assembly of CI-GFP and CI-RFP within Complex I of the respiratory chain. 2D-Blue native PAGE was performed using the mild detergent digitonin. In the first dimension complexes and supercomplexes S0–S1 were separated (DA). Silverstaining of the second dimension, where supercomplexes were separated into subunits by Tricine-SDS-PAGE (DB). Western blot of the separated Complex I subunits with anti-CI30kDa showed the signals of CI-GFP and CI-RFP respectively (D–E), which were not detected in non-transfected cells. * = unidentified protein.
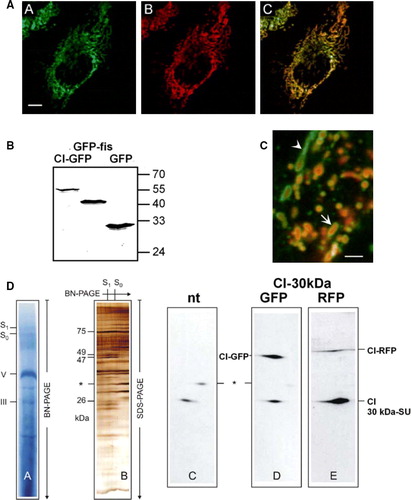
Figure 2. Fusion of mitochondria leads to a homogenous mitochondrial population with patterned chimeric mitochondria. Stable CI-GFP resp. CI-RFP transfected HeLa cells were fused by PEG (see Material and Methods). Subsequent incubation was performed in the presence of 5×10⁻⁶ M cycloheximide (CHX) apart from 2F. Starting from 30 min after PEG treatment, cells were mounted under the confocal laser scanning microscopy (CLSM) and two-colour screening was performed to analyse cellular and mitochondrial fusion. (A) Fusion of differently labelled mitochondria at the fusion interface of two cells 50 min after PEG-treatment. Merging mitochondria are already visible. Bar = 5 µm. (B) More detailed view of fused mitochondria at the fusion interface of two cells 50 min after PEG-treatment. Bar = 1.5 µm. Some hybrid mitochondria display a green-red chequered pattern. (C) 100 min after PEG-treatment all mitochondria of these fused cells had exchanged proteins by mitochondrial fusion. Note the patchy appearance of the mitochondria. Bar = 5 µm. (D) Insert: image C, magnified; the individual mitochondria are clearly red-green chequered. Bar = 1.5 µm. (E) 24 h after PEG-initiated cell fusion the appearance of the hybrid mitochondria is still patchy. Areas of merged green and red fluorescence yield yellow patches. Bar = 1.5 µm. (F) A completed cell fusion 24 h after PEG treatment, but without CHX. Chimeric mitochondria still display a distinct patchy appearance. Bar = 5 µm.: n: nuclei from cells participating in fusion.
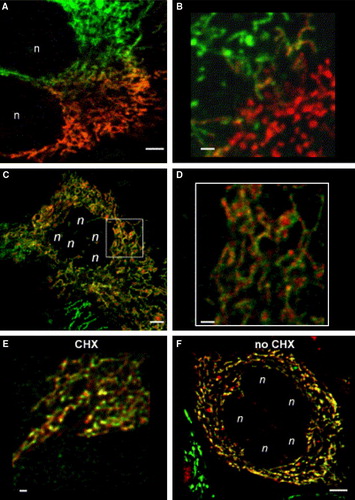
Figure 3. Line plots of fluorescence distribution of Complex I labelled at its subunit 30 kDa in single mitochondria. The fluorescence distribution within single mitochondria varies for both labelled complexes after fusion of differently labelled cells (100 min after cell fusion) but remains separated for at least 1 d, suggesting restriction of motility of Complex I within the inner mitochondrial membrane. (A) Fluorescence distribution of CI-GFP and CI-RFP along the longitudinal axis of a single hybrid mitochondrion 100 min after cell fusion depicted as a line plot. (B) Line plot of the fluorescence signals longitudinal along a single mitochondrion 2 days after co-transfection of cells with CI-GFP and CI-RFP. (C) Fluorescence distribution of labelled Complex I in a single hybrid mitochondrion 1 day after cell fusion with incubation in the presence of protein de novo synthesis inhibitor CHX. (D) Fluorescence distribution of labelled Complex I in a single hybrid mitochondrion 1 day after cell fusion, incubation in the absence of CHX. (E) Fluorescence of CI-mRFP (monomeric) in mitochondria of transfected cells: Line plot of the fluorescence signal longitudinal along a single mitochondrion. (F) Fluorescence of CI-GFP in a single mitochondrion after transfection and staining with MitoTracker Red. Due to the refraction limits of the microscope the real dimensions of the fluorescent structures are no longer revealed, only their position is provided. (G) Fluorescence intensity distribution along a single tubular mitochondrion after transfection with GFP-Tom7, an outer mitochondrial membrane protein. (H) Fluorescence distribution of GFP-hFis1, along a single, tubular mitochondrion. Raw data with no further processing.
Figure 4. Ultrastructure of a mitochondrion with known history of generation. (A) Time series (s) of a rearrangement of the mitochondrial tip of a mitochondrion (arrow at t = 0 s), and fusion of two mitochondria in a primary XTH2 cell (arrowhead, A t= fix 248 s), observed by light microscopy (phase contrast). At about 248 s, the cell has been fixed and the mitochondrion was retrieved in the electron microscope. Two consecutive sections are shown (B and C). Bar: 1 µm. (D) Schematic drawing of cristae arrangements within the mitochondrion previously observed by light microscopy. The branch on the lower part derived from the fusion with a different mitochondrion having emerged from the depth. (E) Magnification of the last LM image of series A before fixation and EM analysis.