Figures & data
Supplementary Table I. Yersinia pestis KIM putative AT proteins.
Supplementary Figure 1. Loci of the 10 AT genes in the genome of Y. pestis KIM. The loci of two pathogenicity islands are also shown, which contain yapC and yapH. The KIM genomic map was constructed based on the information from the restriction map (Zhou et al. [Citation2002]) and genome sequencing of Y. pestis KIM (Deng et al. [Citation2002]).
![Supplementary Figure 1. Loci of the 10 AT genes in the genome of Y. pestis KIM. The loci of two pathogenicity islands are also shown, which contain yapC and yapH. The KIM genomic map was constructed based on the information from the restriction map (Zhou et al. [Citation2002]) and genome sequencing of Y. pestis KIM (Deng et al. [Citation2002]).](/cms/asset/8db1b600-9be6-48e3-b2e2-e49eafff0496/imbc_a_192679_f0001_b.gif)
Figure 1. Phylogenetic tree constructed with the predicted β-domains of identified Y. pestis KIM ATs. The sequences of Yaps were aligned, and the tree was drawn using the neighbor-joining method. The predicted oligomeric states of the β-domains are also indicated.
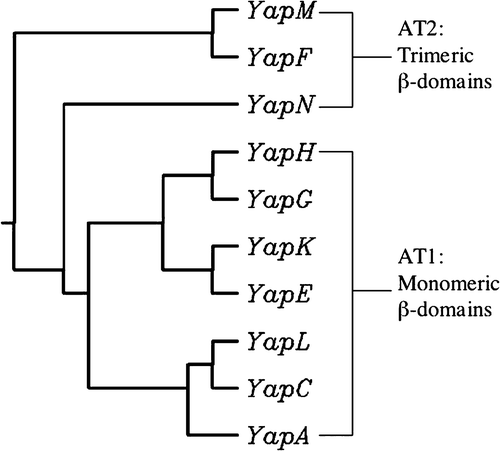
Figure 2. Expression of yap genes in Y. pestis KIM analysed by RT-PCR. Amplicon sizes are indicated above each panel in base pairs (bp). M: molecular markers. Each lane contained 5 µl of a 25 µl reaction resolved on a 2% agarose gel. (a) In both panels, RT-PCR products of yap genes (RT) are shown in lanes 2, 5, 8, 11, and 14; positive PCR control reactions (+) are shown in lanes 3, 6, 9, 12, and 15; and negative PCR control reactions (−) are shown in lanes 4, 7, 10, 13, and 16. The RT-PCR reactions included cDNA as template. The positive PCR reactions included genomic DNA as template. No template was used in the negative PCR reactions. (b) In both panels, positive RT control reactions (+RT) are shown in lane 2; and, negative RT control reactions (−RT) are shown in lanes 4, 6, 8, 10, and 12. Shown side-by-side in lanes 3, 5, 7, 9, 11, and 13 are positive PCR control reactions. The positive RT control reactions included cDNA as template and primers targeting the 16s rRNA gene. The negative RT control reactions contained the PCR amplified products of a negative control performed during reverse transcription. Shown in lane 15 is a control reaction that included 2.4 µg of cleaned RNA as template and primers targeting the 16s rRNA gene; shown side by side in lane 16 is a positive PCR control reaction.
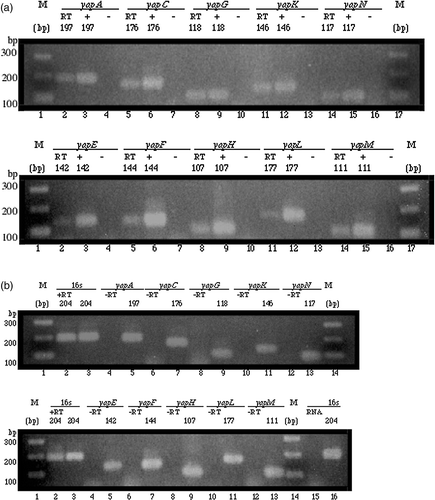
Figure 3. Expression of YapA, YapC, YapG, YapK, and YapN in the RW193 (OmpT+ and OmpP+) and UT5600 (ΔOmpT and ΔOmpP) strains: (a) supernatant fractions (b) OM fractions. Both gels were silver stained. M: molecular markers. CV: cloning vector. RW: RW193. UT: UT5600. Dotted bands represent the identified Yap proteins.
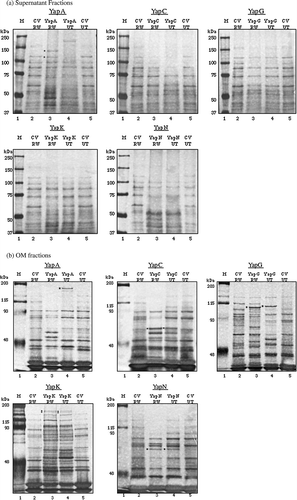
Figure 4. Cell surface localization of YapC and YapN determined by protease accessibility experiments and SDS-PAGE analysis. The gel was silver stained. M: molecular markers. C. V: cloning vector. Treated samples came from whole RW193 cells incubated with 10 µg/ml of Proteinase K followed by OM isolation. Dotted positions are indicated to compare the presence and disappearance of YapC and YapN protein bands.
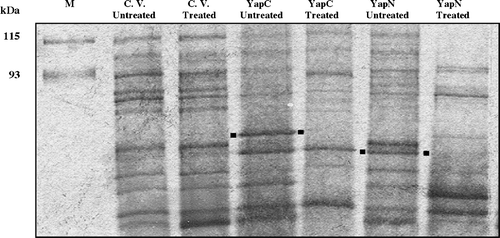
Table I. Hemagglutination activity of Yap proteins.
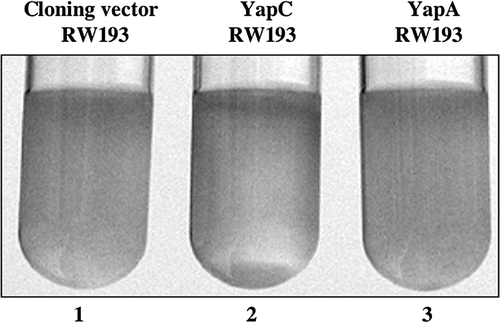
Figure 5. Autoaggregation activity of YapC. E. coli RW193 expressing YapC exhibited a positive autoaggregation phenotype, as indicated by the presence of precipitated cells that form a pellet (lane 2). Strains harboring pCR2.1-TOPO (lane 1) and pYA12-YapA (lane 3) served as negative controls, in which a precipitated pellet is absent.
