Figures & data
Figure 1. Deletion mutations created in human AE1. The open circle shows the position of the hemagglutinin (HA) tag inserted at position 557 of the protein. The sequence and position of the deleted residues are shown in the pane.
Figure 2. Expression of WT and mutant AE1 in transfected HEK 293 cells. (A) Cells transfected with WT AE1 or deletion mutants were lysed in sample buffer containing 100 mM Tris-HCl buffer (pH 6.8), 4% SDS, 200 mM DTT and 20% glycerol and immunoblotting was performed using an anti-AE1 antibody on the transfected HEK 293 cells lysates. The arrow indicates the position of AE1 at approximately 100 (monomer) and 200 (dimer) kDa. (B) The bar graph shows the relative AE1 monomer and dimer expression over three separate experiments. Densitometric scans of immunoblots were used to quantify the relative amount of AE1 using Quantity one − 4.4.0 software (n=3). The data were normalized to WT AE1. The error bars represent±SD.
Figure 3. Pulse chase assay. Transfected cells were pulsed with 50 µCi/ml of [35S]-methionine and cysteine for 20 min. Cells were collected at 0, 1, 5 and 24 h of the chase and AE1 was immunoprecipitated with anti-HA agarose. The amount of radiolabeled AE1 was determined by 8% SDS-PAGE and autoradiography. The arrows indicate the positions of dimer and monomer AE1.
![Figure 3. Pulse chase assay. Transfected cells were pulsed with 50 µCi/ml of [35S]-methionine and cysteine for 20 min. Cells were collected at 0, 1, 5 and 24 h of the chase and AE1 was immunoprecipitated with anti-HA agarose. The amount of radiolabeled AE1 was determined by 8% SDS-PAGE and autoradiography. The arrows indicate the positions of dimer and monomer AE1.](/cms/asset/f9a032ae-6df4-464e-9d71-d30c4bf8e1c1/imbc_a_194439_f0003_b.gif)
Figure 4. Immunolocalization of WT AE1 and its mutants by confocal microscopy. Transiently transfected HEK 293 cells with WT and four mutant constructs carrying the HA tag were fixed, blocked and incubated with mouse monoclonal anti-HA antibody. After three washes, goat anti-mouse antibody coupled to cy5 were added to samples for 30 min prior to mounting the coverslips on slides and observation using a Zeiss laser fluorescence confocal microscope LSM 510. (a) WT AE1; (b) mock transfection; (c) Δ902–906; (d) Δ896–899; (e) Δ891–895; (f) Δ907–911. This Figure is reproduced in colour in Molecular Membrane Biology online.
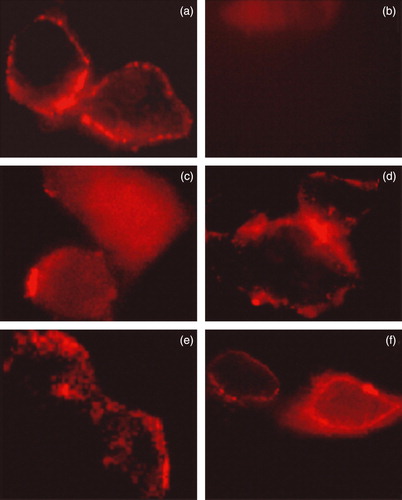
Figure 5. Biotinylation of WT AE1 or deletion mutants. (A) HEK 293 cells were transfected with constructs encoding WT and mutated AE1.Transfected cells were harvested and incubated twice with biotinylation reagent at room temperature before quenching. The fraction of bound (line B) was obtained by eluting the beads with 2×sample loading buffer. Fractions from total cell lysate (lane T), supernatant (lane S) or bound fraction (10 times overloaded) were detected by western blot using anti-AE1 antibody (1/5000), and anti-rabbit antibody coupled to horseradish peroxidase enzyme (1/2000). (B) The quantification of the bands (AE1 dimer) was done using Quantity one − 4.4.0 software. The error bars represent±SD (n=3) (*compare with WT, p < 0.01; **compare with WT, p < 0.05).
Figure 6. Anion exchange assay. HEK 293 cells transiently transfected with WT AE1 or its mutants were loaded with BCECF-AM. Cells were perfused alternately with Cl−-containing (starting from solid bar) and Cl−-free (starting from open bar) Ringer's buffer, and fluorescence in single cells was monitored using excitation wavelengths of 440 and 502 nm and an emission wavelength of 528.7 nm. (a) WT AE1; (b) mock transfection; (c) Δ902–906; (d) Δ896–899; (e) Δ891–895; (f) Δ907–911.
Figure 7. Anion exchange activity was calculated as the dpHi/dt. (A) The initial rate during the first 36 sec after perfusion with Cl_-free Ringer's buffer. (B) The recovery rate during the 36 sec after reintroduction of Cl−-containing Ringer's buffer. Values from AE1 and mutants transfection experiments were replicated in >10 separate transfections respectively (*compare with WT, p < 0.01).