Figures & data
Table I. Aligned sequences of the pore-forming domains in K+ channels and ionotropic glutamate receptors.
Figure 1. H-bonds stabilizing the selectivity-filter region in K+ channels (A) and in the model of the AMPA receptor channel (B). K+ channel is viewed from outside; the AMPAR channel is viewed from inside. The intrasubunit H-bond between Trp-8 and Asp + 5 is conserved in both types of channels. The intersubunit H-bonds between Trp-7 and Tyr + 3 is specific for K+ channels because both the donor and acceptor are absent in the AMPA receptors (see ). Instead, Gln 0 (Q/R) site form intersegment H-bonds in the AMPA receptor. This figure appears in colour in Molecular Membrane Biology online.
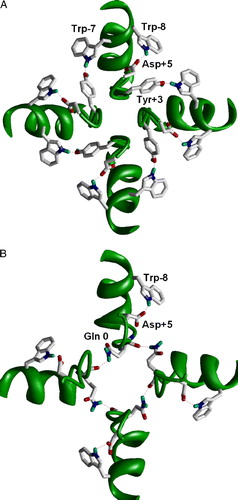
Figure 2. Side view on the MthK-based model of the GluR1 channel. The dicationic derivative of adamantane (IEM-1460) is docked in the narrow part of the pore. The headgroup of the drug binds at the Q/R site, whereas the terminal ammonium group interacts with Gly + 2 residues. Reproduced with permission from Andersen et al. ([Citation2006]). This figure appears in colour in Molecular Membrane Biology online.
![Figure 2. Side view on the MthK-based model of the GluR1 channel. The dicationic derivative of adamantane (IEM-1460) is docked in the narrow part of the pore. The headgroup of the drug binds at the Q/R site, whereas the terminal ammonium group interacts with Gly + 2 residues. Reproduced with permission from Andersen et al. ([Citation2006]). This figure appears in colour in Molecular Membrane Biology online.](/cms/asset/b3698a9b-a780-4264-9cc6-d39052fa0b44/imbc_a_200775_f0002_b.jpg)
Figure 3. Side view on the selectivity-filter region of K+ channel and the AMPA receptor channel model. Subunit at the left represents the proposed slow-inactivated conformation (Berneche & Roux [Citation2005]). Oxygen in position +1 is turned away from the pore. In the model of the AMPA receptor channel (right) one lumen-facing oxygen is lost because of deletion (see ). The oxygen in position 0 is involved in the intersegment H-bonds and the next one is turned away. As a result, the model has only one lumen-facing oxygen ring. This figure appears in colour in Molecular Membrane Biology online.
![Figure 3. Side view on the selectivity-filter region of K+ channel and the AMPA receptor channel model. Subunit at the left represents the proposed slow-inactivated conformation (Berneche & Roux [Citation2005]). Oxygen in position +1 is turned away from the pore. In the model of the AMPA receptor channel (right) one lumen-facing oxygen is lost because of deletion (see Table I). The oxygen in position 0 is involved in the intersegment H-bonds and the next one is turned away. As a result, the model has only one lumen-facing oxygen ring. This figure appears in colour in Molecular Membrane Biology online.](/cms/asset/d43599aa-fccf-4b37-86f8-1349c9e33267/imbc_a_200775_f0003_b.jpg)
Figure 4. The optimal binding mode of MK801 in the model of the NMDA receptor channel. (A) Extracellular view. (B) Side view with one subunit removed. MK801 molecule is shown as sticks with van der Waals contour. The ligand-sensing residues are space filled. Asn residues of the ‘N’-site are shown red, residues in position –1 are shown white, and residues in positions +25, +28 and +29 are shown yellow. This figure appears in colour in Molecular Membrane Biology online.
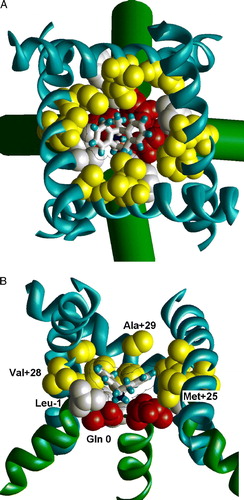
Figure 5. Cys labeling of the M3 segment of AMPA receptor. (A and B) Open channel model. (C and D) Closed channel model. A, C and D are viewed from outside; B, side view. Labeled residues are space filled red. (A) Labeled residues line the open channel. (B) Side view on labeled residues in the M2-M3 contact. MTS reagent can reach this region through the hole above M2 helices. (C) Labeled residues L + 25, I + 28 and T + 32 face the cavity of the closed channel. (D) Labeled residues L + 35 and F + 38 are projected outwards. This figure appears in colour in Molecular Membrane Biology online.
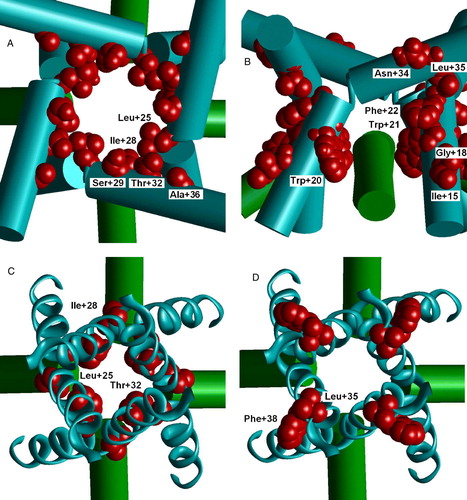
Figure 6. The side (A) and top (B) views of the low-energy conformations of MTSET bound to Cys residue in alpha helix. Positions of the nitrogen atom are shown as small blue spheres. Flexibility of the label allows wide distribution of its terminal group. This figure appears in colour in Molecular Membrane Biology online.
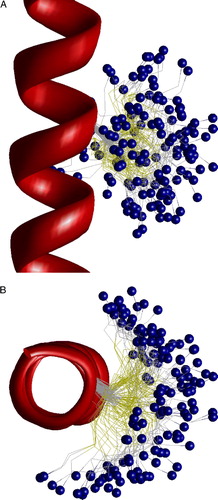
Figure 7. Side view on the superimposition of the closed channel models with L + 25, I + 28 and T + 32 substituted by MTSET bound cysteines. Due to conformational flexibility of the label, the ammonium groups of all three substitutes are located at the focus of M2 helical dipoles. This figure appears in colour in Molecular Membrane Biology online.
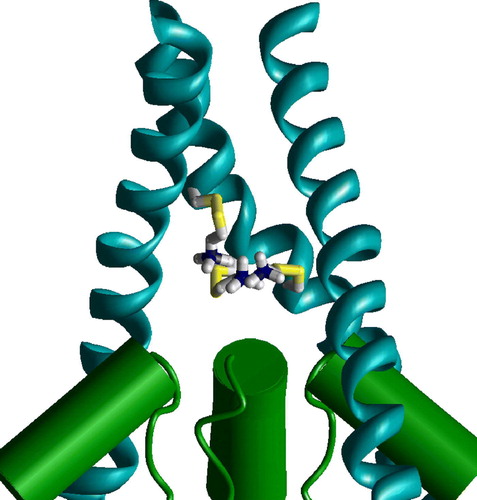
Figure 8. Staggering of the M3 segments of NMDA receptor is explained by different slope. In the heteromeric model M3 segments of NR1 subunits (magenta) are KvAP-like, whereas M3 segments of NR2 subunits (yellow) are MthK-like. Residues at positions 37 (NR1) and 33 (NR2) are at the same level (space filled red). This figure appears in colour in Molecular Membrane Biology online.
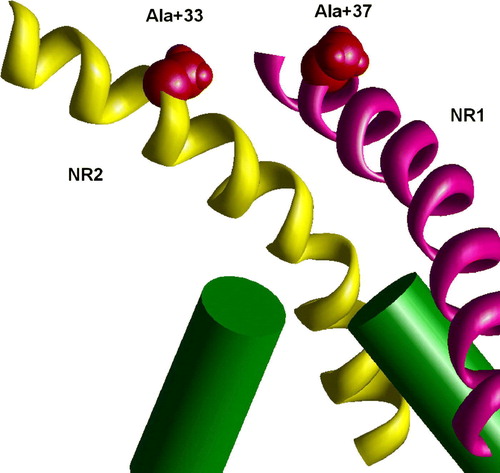
Figure 9. The binding of Cu2 + ions in the model of the double mutant NR1 T32/C NR2 L28/C. Due to different slope of M3 segments in NR1 (KvAP-like conformation, magenta) and NR2 (MthK-like conformation, yellow) these residues are at the same level and effectively bind Cu2 + ion. This figure appears in colour in Molecular Membrane Biology online.
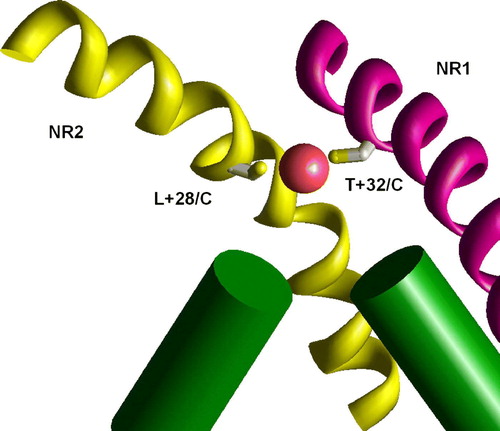
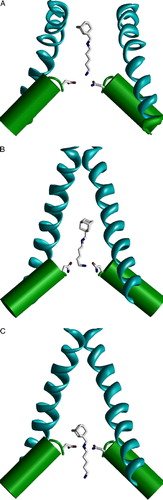
Figure 10. Binding of the dicationic adamantane derivative IEM-1754 to the open and closed models of the NMDA receptor channel. Asn residues of the ‘N’-site are shown as sticks. (A and B) IEM-1754 binds to the N site by the terminal amino group. Binding modes in the open channel model (A) and in the closed channel model (B) are different due to the limited space in the closed channel cavity. The permeation of the tail through the selectivity filter allows binding of the secondary amino group to the ‘N’-site (C). Unlike the shallow binding mode (A), this deep binding mode permits channel closure and trapping. This figure appears in colour in Molecular Membrane Biology online.
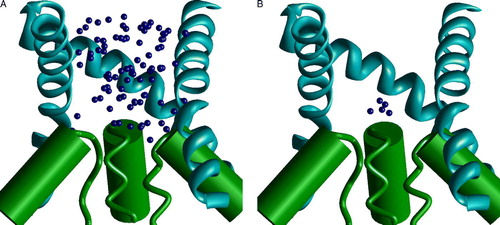
Supplementary Figure 1. The random docking search of the optimal binding mode of MK801 in the model of NMDA receptor channel. Side views with one subunit hidden. (A and B) The two steps of the random-docking procedure. Blue spheres represent positions of the nitrogen atom of MK801. (A) 100 best structures obtained after short optimization of 5000 random positions of the drug molecule. Possible positions of the drug fit the outer vestibule of the channel. (B) Five best complexes obtained after long optimization of the structures shown in A. The charged amino group is bound at the focus of macrodipoles of the M2 helices.