408
Views
7
CrossRef citations to date
0
Altmetric
Original

Kv1 potassium channel C-terminus constant HRETE region: arginine substitution affects surface protein level and conductance level of subfamily members differentially

, , &
Pages 194-205 | Received 16 Jun 2006, Published online: 09 Jul 2009

Figures & data

Figure 1.  Kv1.1H416stop affected conductance levels more than cell surface protein levels. Transfected CHO cells were analyzed for Kv1 functional expression (Gm/Cm) by patch-clamping and for Kv1 cell surface protein levels by biotinylation/immunoblotting and Kv1 total protein levels by immunoblotting as described in methods. (A) Conductance densities (Gm/Cm, maximum conductance divided by capacitance) of Kv1.1 and Kv1.1H416stop by patch-clamping. Kv1.1 values were taken as 100.0±SEM and Kv1.1H416stop values were normalized to it (n=8–12). Representative current traces for the Kv1.1 constructs are shown at the bottom with ms = milliseconds and nA = nanoamp. (B) Surface protein levels of Kv1.1 and Kv1.1H416stop from biotinylation/immunoblots. Kv1.1 values were taken as 100.0±SEM and Kv1.1H416stop values were normalized to it (n=3). (C) Total protein levels of Kv1.1 and Kv1.1H416stop (immunoblots not shown). Kv1.1 values were taken as 100.0±SEM and Kv1.1H416stop values were normalized to it (n=3). (D) Relative surface expression by dividing the surface protein values in B by the total protein values in C.
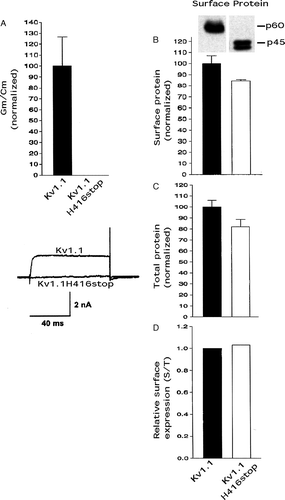
Figure 1.  Kv1.1H416stop affected conductance levels more than cell surface protein levels. Transfected CHO cells were analyzed for Kv1 functional expression (Gm/Cm) by patch-clamping and for Kv1 cell surface protein levels by biotinylation/immunoblotting and Kv1 total protein levels by immunoblotting as described in methods. (A) Conductance densities (Gm/Cm, maximum conductance divided by capacitance) of Kv1.1 and Kv1.1H416stop by patch-clamping. Kv1.1 values were taken as 100.0±SEM and Kv1.1H416stop values were normalized to it (n=8–12). Representative current traces for the Kv1.1 constructs are shown at the bottom with ms = milliseconds and nA = nanoamp. (B) Surface protein levels of Kv1.1 and Kv1.1H416stop from biotinylation/immunoblots. Kv1.1 values were taken as 100.0±SEM and Kv1.1H416stop values were normalized to it (n=3). (C) Total protein levels of Kv1.1 and Kv1.1H416stop (immunoblots not shown). Kv1.1 values were taken as 100.0±SEM and Kv1.1H416stop values were normalized to it (n=3). (D) Relative surface expression by dividing the surface protein values in B by the total protein values in C.

Figure 2.  Kv1.1R417stop affected conductance levels more than cell surface protein levels and a bulky hydrophilic amino acid substitution at R417 restored conductance expression. Transfected CHO cells were analyzed for conductance densities, surface protein levels, and total protein levels as described in the legend. (A) The HRETE sequence in full length Kv1.1 and Kv1.1 truncation mutants used here. (B) Kv1.1 conductance density (Gm/Cm) was taken as 100.0±SEM and the Kv1.1 truncation mutants were normalized to it (n=8–12). (C) Kv1.1 surface protein was taken as 100.0±SEM and the Kv1.1 truncation mutants were normalized to it (n=3) (immunoblots not shown). (D) Kv1.1 total protein was taken as 100.0±SEM and the Kv1.1 truncation mutants were normalized to it (n=3) (immunoblots not shown). (E) Relative surface expression by dividing the surface protein values in C by the total protein values in D.
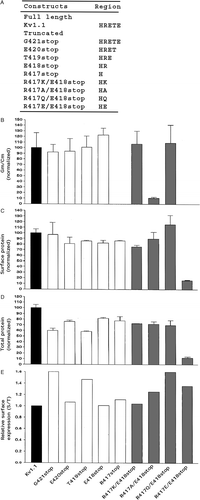
Figure 2.  Kv1.1R417stop affected conductance levels more than cell surface protein levels and a bulky hydrophilic amino acid substitution at R417 restored conductance expression. Transfected CHO cells were analyzed for conductance densities, surface protein levels, and total protein levels as described in the Figure 1 legend. (A) The HRETE sequence in full length Kv1.1 and Kv1.1 truncation mutants used here. (B) Kv1.1 conductance density (Gm/Cm) was taken as 100.0±SEM and the Kv1.1 truncation mutants were normalized to it (n=8–12). (C) Kv1.1 surface protein was taken as 100.0±SEM and the Kv1.1 truncation mutants were normalized to it (n=3) (immunoblots not shown). (D) Kv1.1 total protein was taken as 100.0±SEM and the Kv1.1 truncation mutants were normalized to it (n=3) (immunoblots not shown). (E) Relative surface expression by dividing the surface protein values in C by the total protein values in D.

Figure 3.  Kv1.1R417A affected conductance levels more than cell surface protein levels. Transfected CHO cells were analyzed for conductance densities, surface protein levels, and total protein levels as described in the legend. (A) The HRETE sequence in full length Kv1.1 and the full length Kv1.1 site-directed mutants used here. (B) Kv1.1 conductance density (GmCm) was taken as 100.0±SEM and the Kv1.1 site-directed mutants were normalized to it (n=8–12). (C) Kv1.1 surface protein was taken as 100.0±SEM and the Kv1.1 site-directed mutants were normalized to it (n=3). (D) Kv1.1 total protein was taken as 100.0±SEM and the Kv1.1 site-directed mutants were normalized to it (n=3) (immunoblots not shown). (E) Relative surface expression by dividing the surface protein values in C by the total protein values in D. (F) Enriched ER (endoplasmic reticulum) Kv1.1 protein as outlined in methods. Kv1.1 enriched ER protein was taken as 100.0±SEM and the Kv1.1R417A was normalized to it (n=3) (immunoblots not shown). (G) Cell surface protein of Kv1.1-flag, Kv1.1R417A-flag, and Kv1.1R417stop-flag (flag #1 and flag #2 are two cDNAs recovered from different bacterial colonies) by flag antibody binding to cell surface Kv1.1 construct proteins in intact cells followed by immunopurification of these complexes with flag antibody and then immunoblotting with Kv1.1 antibody.
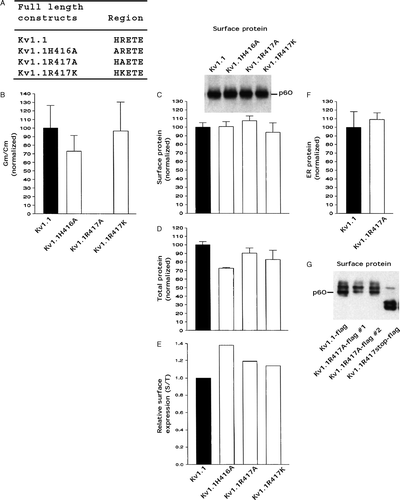
Figure 3.  Kv1.1R417A affected conductance levels more than cell surface protein levels. Transfected CHO cells were analyzed for conductance densities, surface protein levels, and total protein levels as described in the Figure 1 legend. (A) The HRETE sequence in full length Kv1.1 and the full length Kv1.1 site-directed mutants used here. (B) Kv1.1 conductance density (GmCm) was taken as 100.0±SEM and the Kv1.1 site-directed mutants were normalized to it (n=8–12). (C) Kv1.1 surface protein was taken as 100.0±SEM and the Kv1.1 site-directed mutants were normalized to it (n=3). (D) Kv1.1 total protein was taken as 100.0±SEM and the Kv1.1 site-directed mutants were normalized to it (n=3) (immunoblots not shown). (E) Relative surface expression by dividing the surface protein values in C by the total protein values in D. (F) Enriched ER (endoplasmic reticulum) Kv1.1 protein as outlined in methods. Kv1.1 enriched ER protein was taken as 100.0±SEM and the Kv1.1R417A was normalized to it (n=3) (immunoblots not shown). (G) Cell surface protein of Kv1.1-flag, Kv1.1R417A-flag, and Kv1.1R417stop-flag (flag #1 and flag #2 are two cDNAs recovered from different bacterial colonies) by flag antibody binding to cell surface Kv1.1 construct proteins in intact cells followed by immunopurification of these complexes with flag antibody and then immunoblotting with Kv1.1 antibody.

Figure 4.  An R to A mutation in HRETE in Kv1.2 and Kv1.4 affected cell surface protein levels more than conductance levels. Transfected CHO cells were analyzed for conductance density, surface protein level, and total protein level as described in the legend. (A) The HRETE sequence in full length Kv1.2, Kv1.2R419A, Kv1.4, and Kv1.4R571A. (B) Kv1.2 conductance density (Gm/Cm) was taken as 100.0±SEM and Kv1.2R419A was normalized to it (n=8–12). Kv1.4 conductance density (Gm/Cm) was taken as 100.0±SEM and Kv1.4R571A was normalized to it (n=8–12). Representative current traces for the Kv1.2 and Kv1.4 constructs are shown at the bottom. (C) Kv1.2 surface protein was taken as 100.0±SEM and Kv1.2R419A was normalized to it (n=3). Kv1.4 surface protein was taken as 100.0±SEM and Kv1.4R571A was normalized to it (n=3). (D) Kv1.2 total protein was taken as 100.0±SEM and Kv1.2R419A was normalized to it (n=3) (immunoblots not shown). Kv1.4 total protein was taken as 100.0±SEM and Kv1.4R571A was normalized to it (n=3) (immunoblots not shown). (E) Relative surface expression by dividing the surface protein values in C by the total protein values in D. (F) Enriched ER (endoplasmic reticulum) Kv1.2 protein as outlined in methods. Kv1.2 enriched ER protein was taken as 100.0±SEM and the Kv1.2R419A was normalized to it (n=3) (immunoblots not shown).
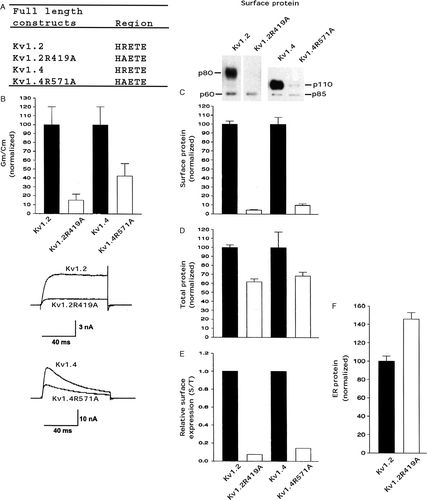
Figure 4.  An R to A mutation in HRETE in Kv1.2 and Kv1.4 affected cell surface protein levels more than conductance levels. Transfected CHO cells were analyzed for conductance density, surface protein level, and total protein level as described in the Figure 1 legend. (A) The HRETE sequence in full length Kv1.2, Kv1.2R419A, Kv1.4, and Kv1.4R571A. (B) Kv1.2 conductance density (Gm/Cm) was taken as 100.0±SEM and Kv1.2R419A was normalized to it (n=8–12). Kv1.4 conductance density (Gm/Cm) was taken as 100.0±SEM and Kv1.4R571A was normalized to it (n=8–12). Representative current traces for the Kv1.2 and Kv1.4 constructs are shown at the bottom. (C) Kv1.2 surface protein was taken as 100.0±SEM and Kv1.2R419A was normalized to it (n=3). Kv1.4 surface protein was taken as 100.0±SEM and Kv1.4R571A was normalized to it (n=3). (D) Kv1.2 total protein was taken as 100.0±SEM and Kv1.2R419A was normalized to it (n=3) (immunoblots not shown). Kv1.4 total protein was taken as 100.0±SEM and Kv1.4R571A was normalized to it (n=3) (immunoblots not shown). (E) Relative surface expression by dividing the surface protein values in C by the total protein values in D. (F) Enriched ER (endoplasmic reticulum) Kv1.2 protein as outlined in methods. Kv1.2 enriched ER protein was taken as 100.0±SEM and the Kv1.2R419A was normalized to it (n=3) (immunoblots not shown).

Figure 5.  The double mutant Kv1.1S369T/R417A affected cell surface protein levels more than conductance levels. Transfected CHO cells were analyzed for conductance densities, surface protein levels, and total protein levels as described in the legend. (A) The HRETE sequence in full length Kv1.1S369T and Kv1.1S369T/R417A. (B) Kv1.1S369T conductance density (Gm/Cm) was taken as 100.0±SEM and Kv1.1S369T/R417A was normalized to it (n=8–12). (C) Kv1.1S369T surface protein was taken as 100.0±SEM and Kv1.1S369T/R417A was normalized to it (n=3). (D) Kv1.1S369T total protein was taken as 100.0±SEM and Kv1.1S369T/R417A was normalized to it (n=3) (immunoblots not shown). (E) Relative surface expression by dividing the surface protein values in C by the total protein values in D.
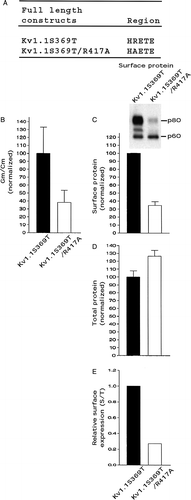
Figure 5.  The double mutant Kv1.1S369T/R417A affected cell surface protein levels more than conductance levels. Transfected CHO cells were analyzed for conductance densities, surface protein levels, and total protein levels as described in the Figure 1 legend. (A) The HRETE sequence in full length Kv1.1S369T and Kv1.1S369T/R417A. (B) Kv1.1S369T conductance density (Gm/Cm) was taken as 100.0±SEM and Kv1.1S369T/R417A was normalized to it (n=8–12). (C) Kv1.1S369T surface protein was taken as 100.0±SEM and Kv1.1S369T/R417A was normalized to it (n=3). (D) Kv1.1S369T total protein was taken as 100.0±SEM and Kv1.1S369T/R417A was normalized to it (n=3) (immunoblots not shown). (E) Relative surface expression by dividing the surface protein values in C by the total protein values in D.

Reprints and Corporate Permissions

Please note: Selecting permissions does not provide access to the full text of the article, please see our help page How do I view content?

To request a reprint or corporate permissions for this article, please click on the relevant link below:

Academic Permissions

Please note: Selecting permissions does not provide access to the full text of the article, please see our help page How do I view content?

Obtain permissions instantly via Rightslink by clicking on the button below:

If you are unable to obtain permissions via Rightslink, please complete and submit this Permissions form. For more information, please visit our Permissions help page.