Figures & data
Figure 1. Expression levels of AmtB in selected variants. (A) Western blots of membrane fractions from wild-type and a selection of AmtB variants. 5µg of protein was loaded in each lane. Estimated molecular weight of major band is indicated to the left of the panel. (B) Activity, in a washed assay, of each of the variants shown in panel A, expressed as a % of the wild-type.
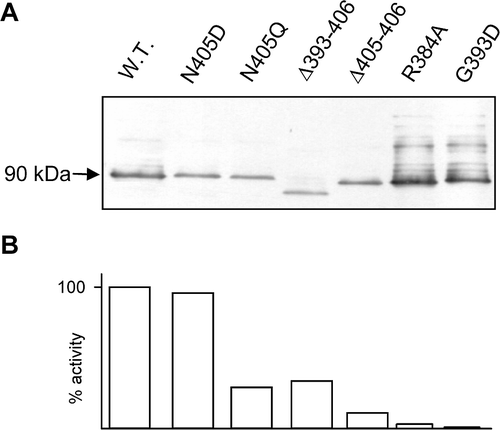
Table I. Relative [14C]-accumulation rates of GT1000 cells expressing AmtB CTR variants.
Table II. AmtB activities of representative variants measured in the ‘unwashed’ [14C]MA uptake assay.
Figure 2. Detection of AmtBHA1, a HA-tagged derivative of AmtB, by western blotting. (A) Whole cell lysates (W), cytoplasmic (C) and membrane (M) fractions of GT1000(pGC2)-AmtB1, and GT1000(pESVHA1)-AmtBHA1, probed with αAmtB antiserum. (B) The same samples as in A, probed with αHA antibody. Estimated molecular weights of major bands are indicated to the left of the panels.
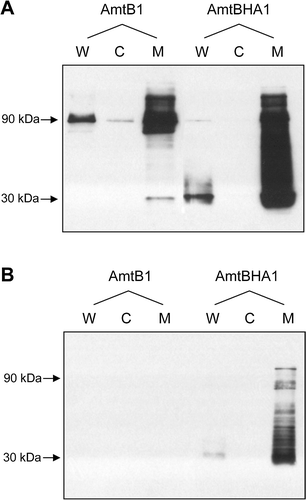
Figure 3. Titration of the in vivo levels of AmtB variant proteins. Membrane fractions from GT1000(pESVHA1), GT1000(pESVHA2) and GT1000(pESVHA4) were freeze-thawed to disassemble AmtB into the monomer. Serial 2-fold dilutions of those preparations were probed with the αHA antibody. Amounts of protein loaded are indicated below the control in panel A. Estimated molecular weights of major bands are indicated to the left of the panels.
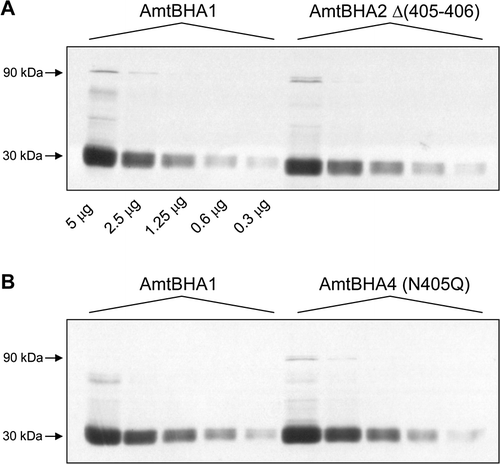
Figure 4. Interaction of AmtB CTR variants with GlnK. Whole cell lysates (W), cytoplasmic (C) and membrane (M) fractions were probed with a αGlnK antiserum. -N: no NH4Cl added; +N: after addition to the culture of 30 mM NH4Cl for 15 min. The AmtB variants co-expressed with GlnK are indicated above the lanes. Data for representative variants are shown. Similar assays were carried out with Δ(399–406), R384A, G393D, G393R, Y404G, N405A and N405Q all of which showed no GlnK sequestration.
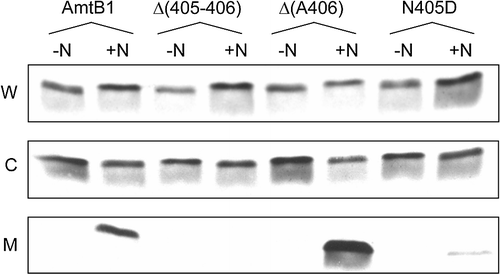
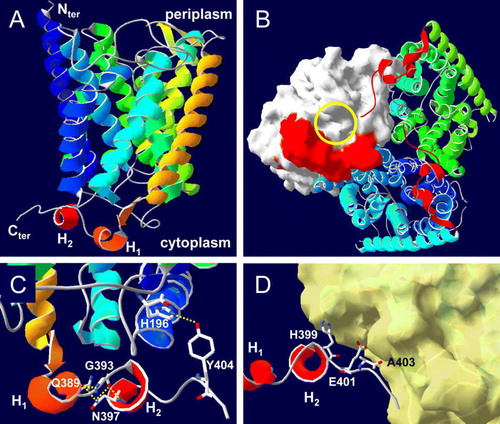
Figure 5. Model for the CTR of E. coli AmtB. This model was derived as described in Materials and methods. (A) A single AmtB subunit showing the predicted CTR structure. The two helices of the CTR; from E387 to R391 and from D395 to S398 are labelled H1 and H2 respectively. (B) The cytoplasmic face of the AmtB trimer. Two monomers are shown as ribbons, the molecular surface of the third is shown in white and its cytoplasmic vestibule is indicated by the yellow circle (in on-line Figure). The CTR of each monomer is represented in red (in on-line Figure). (C) Hydrogen bonding (yellow dashed lines in on-line Figure) between Y404 and H196 (2.79 Å) and between G393, Q389 and N397. (D) Potential contacts between the H399, E401 and A403 side chains from one monomer (the core of the monomer has been removed) with the cytoplasmic face of the adjacent subunit of which the molecular surface is shown in yellow (in on-line Figure). This Figure is reproduced in colour in Molecular Membrane Biology on-line.
Supplementary Table I. Plasmid-encoded AmtB variants.
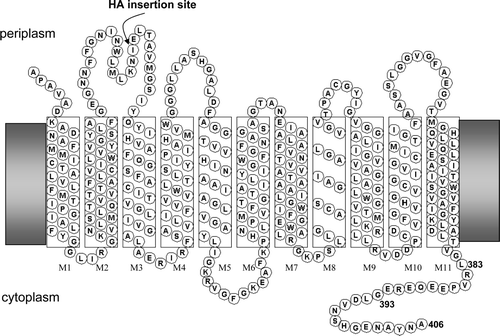
Supplementary Figure 1. Topology of E. coli AmtB. Position of insertion of haemagglutinin (HA) epitope in some variants is indicated.
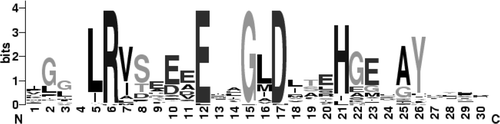
Supplementary Figure 2. Sequence logo for the CTR of Amt proteins. The logo was generated using WebLogo (Crooks et al. 2004) from a CLUSTALW alignment of 51 Amt proteins including 27 from bacteria, 7 from archaea, 4 from fungi, 9 from plants, and 4 from C. elegans. L5 in the logo alignment is equivalent to L383 in E. coli AmtB and the highly conserved glycine residue, G15 in the logo, is G393.