Figures & data
Supplementary Table I. Transport proteins examined in this study.
Supplementary Table II. Oligonucleotides used in this study.
Figure 1. Diagrammatic representations of the putative membrane topologies of the proteins examined in this study. References in support of these topologies are listed in Supplementary (online version only).
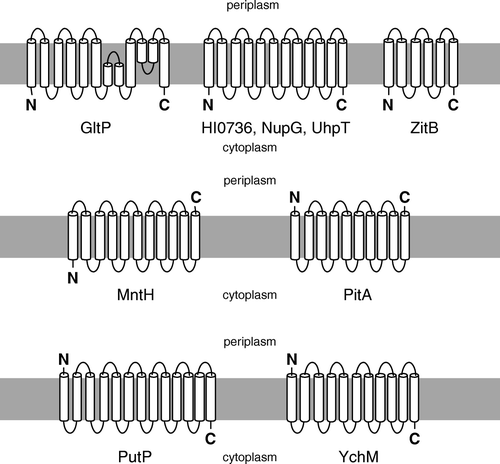
Figure 2. Comparison of NupG expression levels yielded by constructs generated by recombinational and conventional cloning. Membranes (20 µg) from non-induced and 1 mM IPTG-induced cultures of E. coli strain Tuner(DE3)pLysS harbouring the indicated constructs were subjected to SDS-PAGE followed by (A) Coomassie blue staining or (B) Western blotting and staining with HisProbe™–HRP. pMR1 is vector lacking an insert, pLMP-01-NupG and pLMP-01-NupGE were produced by recombinational cloning, and pGJL25 was produced by conventional cloning. The mobilities of marker proteins of known molecular mass are shown on the right and the position of the overexpressed monomeric form of NupG is arrowed.
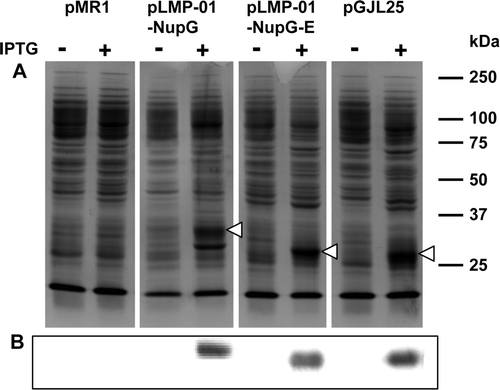
Figure 3. Use of recombinational cloning for expression of transporters from three different protein families. Membranes (20 µg) from IPTG-induced cultures of E. coli strain Tuner(DE3)pLysS (A, B) or BL21 (C-F) harbouring the indicated constructs were subjected to SDS-PAGE. Proteins were detected using Coomassie blue (A, C, E), Lumio™ Green (B) or by staining Western blots with HisProbe™–HRP (D, F). Constructs designated ‘-R’ were produced by recombinational cloning, while those designated ‘-C’ were produced by conventional cloning. The mobilities of marker proteins of known molecular mass are shown on the left and the positions of the overexpressed monomeric forms of the proteins are indicated by arrowheads.
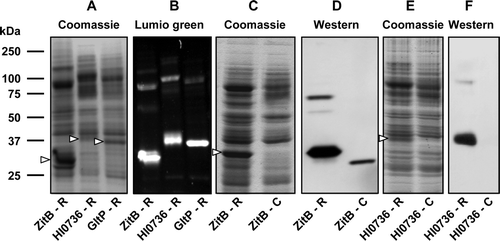
Figure 4. Use of Strep-tag II for detection and purification of proteins bearing periplasmic C-termini. Membranes (20 µg) from 0.1 mM IPTG-induced or non-induced cultures of E. coli strain BL21 harbouring pTTQ18-Strep II-PitA (A, B; PitA bearing a C-terminal Strep-tag II) or pTTQ18-Strep II-MntH (C, D; MntH bearing a C-terminal Strep-tag II) were subjected to SDS-PAGE. Proteins were detected using Coomassie blue (A, C) or by staining Western blots with Strep-tactin-HRP (B, D). Panel E shows purified MntH C-terminally tagged with a Strep-tag II peptide linked via G5SA. The mobilities of marker proteins of known molecular mass are shown on the right and the positions of the overexpressed monomeric forms of the proteins are indicated by arrowheads.
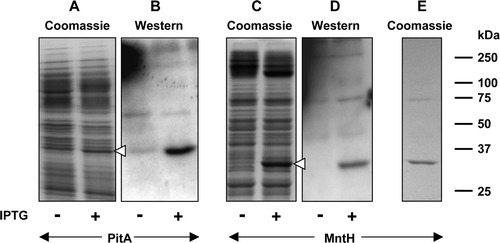
Figure 5. Effect of tag type and location on expression of MntH. Membrane samples (20 µg) were prepared from cultures of E. coli strain BL21 harbouring the indicated MntH constructs, before and after induction with 0.1 mM IPTG. MntH-H8: pMR4-MntH, encoding MntH bearing a C-terminal His8 tag; MntH-lumio: pMR5-MntH, encoding MntH bearing a C-terminal Lumio™ tag; H8-MntH: pMR2-MntH, encoding MntH bearing an N-terminal His8 tag. Proteins were detected using Coomassie blue (A, C, E, G), Lumio™ Green (D) or by staining Western blots with HisProbe™–HRP (B, F). Panel G shows purified MntH bearing an N-terminal His8 tag. The mobilities of marker proteins of known molecular mass are shown on the right and the positions of the overexpressed monomeric forms of MntH are indicated by arrowheads.
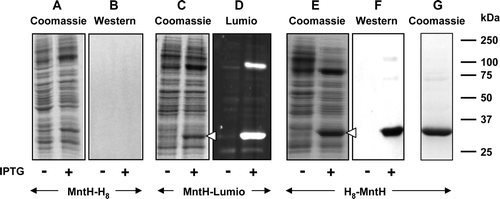
Figure 6. C-terminal His-tagging of membrane proteins with an odd number of TM segments and a cytoplasmic C-terminus. Membranes were prepared, before and after induction with 0.1 mM or 1 mM IPTG respectively, from cultures of E. coli strain BL21 harbouring constructs encoding PutP-RGSH6 or YchN-RGSH6. Samples (20 µg) were subjected to SDS-PAGE followed by Coomassie blue staining (A, C, E) or Western blotting and staining with HisProbe™–HRP (B, D). Panel E shows purified PutP-RGSH6. The mobilities of marker proteins of known molecular mass are shown on the right.
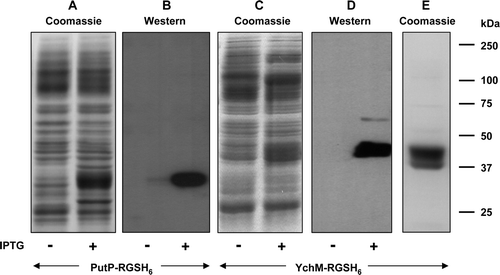
Figure 7. Characterization of the E. coli glutamate/aspartate transporter GltP expressed using recombinational cloning. (A) Comparison of [3H]glutamate uptake by IPTG-induced E. coli harbouring pLMP-01-GltP (recombinational cloning product), the corresponding parental vector pMR1, pTTQ18-RGSH6-GltP (conventional cloning product) or the corresponding parental vector pTTQ18. (B) Coomassie blue-stained SDS-polyacrylamide gel of purified GltP(TEV-Lumio™-His8). The mobilities of marker proteins of known molecular mass are shown on the left and the positions of putative GltP oligomers are indicated by arrowheads. (C) Thermal unfolding of purified GltP(TEV-Lumio™-His8). CD measurements were made during the heating of the protein at a rate of 0.6°C per min. (D) Amide I region of the FTIR spectrum of a hydrated film of GltP(TEV-Lumio™-His8), and bands obtained by deconvolution. The latter were assigned to β-sheet (i & vi), unordered structure (ii), a-helix (iii) and β-turns (iv & v). The dotted line shows the curve fitted using these component bands.
![Figure 7. Characterization of the E. coli glutamate/aspartate transporter GltP expressed using recombinational cloning. (A) Comparison of [3H]glutamate uptake by IPTG-induced E. coli harbouring pLMP-01-GltP (recombinational cloning product), the corresponding parental vector pMR1, pTTQ18-RGSH6-GltP (conventional cloning product) or the corresponding parental vector pTTQ18. (B) Coomassie blue-stained SDS-polyacrylamide gel of purified GltP(TEV-Lumio™-His8). The mobilities of marker proteins of known molecular mass are shown on the left and the positions of putative GltP oligomers are indicated by arrowheads. (C) Thermal unfolding of purified GltP(TEV-Lumio™-His8). CD measurements were made during the heating of the protein at a rate of 0.6°C per min. (D) Amide I region of the FTIR spectrum of a hydrated film of GltP(TEV-Lumio™-His8), and bands obtained by deconvolution. The latter were assigned to β-sheet (i & vi), unordered structure (ii), a-helix (iii) and β-turns (iv & v). The dotted line shows the curve fitted using these component bands.](/cms/asset/7b70dd02-03ba-40fe-acd2-c83357718a5b/imbc_a_224312_f0007_b.gif)
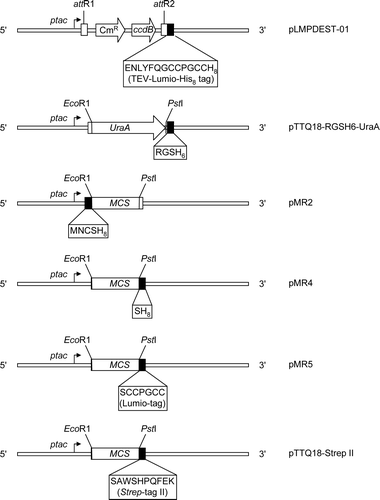
Supplementary Figure 1. Graphical representation of pTTQ18-based expression vectors employed in this study, illustrating the encoded tag sequences and key restriction sites. ptac, tac promoter; CmR, chloramphenicol resistance marker; ccdB, gene resulting in lethality towards most E. coli strains because of the interaction of its protein product with DNA gyrase; attR1 & attR2, modified λ phage recombination sites; MCS, multicloning site; UraA, E. coli uracil transporter gene.
