Figures & data
Table 1. Outcome indicators and data sources
Table 2. Displacement and delivery characteristics of PEI respondents with matched partographs, by time point
Table 3. Sociodemographic characteristics by time point
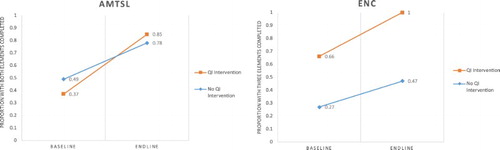
Figure 1. Change within groups between baseline and endline for AMTSL and ENC. North Kivu, DRC 2015–2017