Figures & data
Figure 1. Demand for offshore financial services in Mexico.
Source: BIS, World Bank, own calculations.
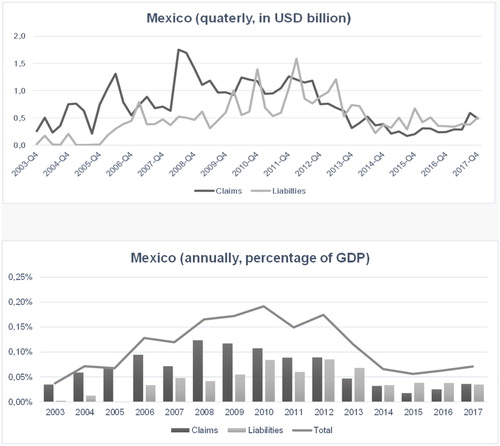
Table 1. Overview of the scope of Mexico’s offshore demand (2003–2017).
Figure 2. Mexico’s offshore demand in context.
Source: BIS, World Bank, own calculations.
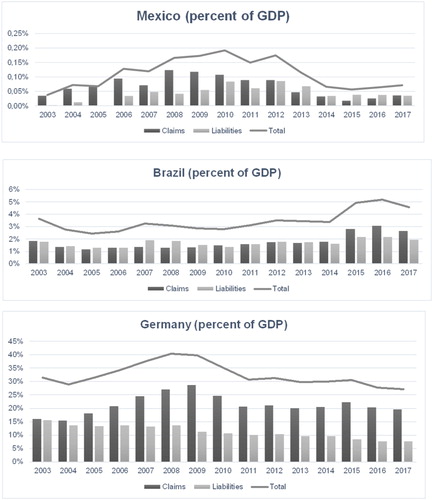
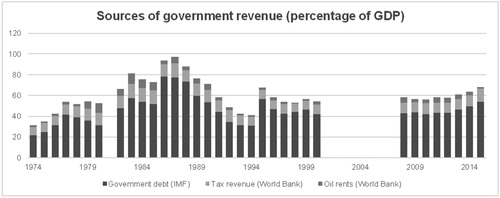
Figure 3. Government revenue 1974–2015 (percent of GDP). Source: IMF, World Bank, own calculations.
Note: The oil rents are only indicative for the volume of government oil revenue. Not all oil rents are automatically government revenue. The government levies tax on the oil rents and as the owner of PEMEX receives all profits that are not reinvested. The Mexican government does not publish an exact breakdown of oil revenue data.