Figures & data
Figure 1. Building state capacity: yearly averages of bureaucratic and judicial capacity for new member states (1997–2005) and Candidate countries (2005–2013).
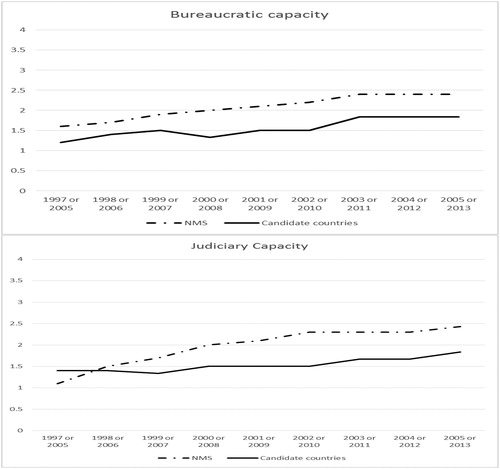
Figure 2. Net exports of high-skill goods in 1996 and 2014 (percentage and percentage points of GDP).
Note: The chart shows data from 1996 to 2014 (if available). The blue points show the difference between high-skill net exports of GDP in 1996 and 2014.
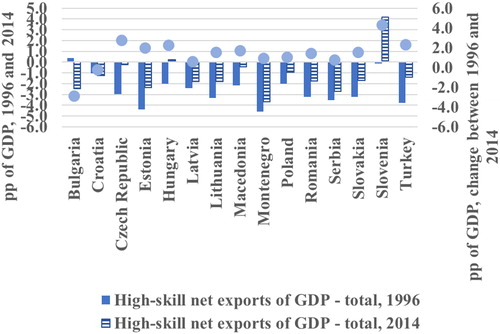
Figure 3. Net exports of high-tech goods in 1996 and 2014 (percentage and percentage points of GDP).
Note: The chart shows data from 1996 to 2014 (if available). The blue points show the difference between high-tech net exports of GDP in 1996 and 2014.
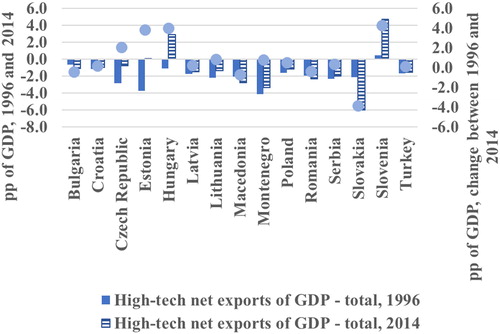
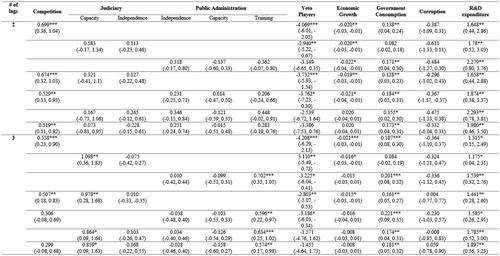
Figure 4. Regressions – total net exports of goods (as a share of GDP).
Note: All regressions contain country and time fixed effects. Significant codes: ***0.001, **0.01 and *0.05.
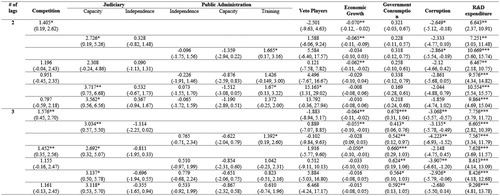
Figure 5. Regressions – high-tech net exports of goods (as a share of GDP).
Note: All regressions contain country and time fixed effects. Significant codes: ***0.001, **0.01 and *0.05.
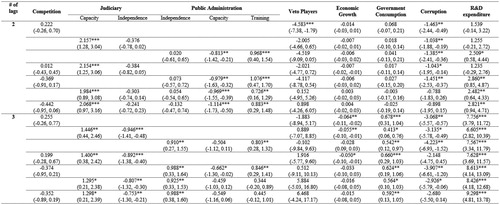
Figure 6. Regressions – high-skill net exports of goods (as a share of GDP).
Note: All regressions contain country and time fixed effects. Significant codes: ***0.001, **0.01 and *0.05.