Figures & data
Figure 1. The increasing importance of Foreign Direct Investment. (A) FDI inflows by region (B) FDI stock by region. All FDI data was collected from the UNCTAD World Investment Report (2018).
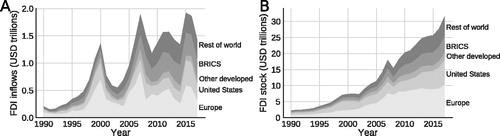
Figure 2. Corporate structure of a large food company. Nodes represent different subsidiaries, connected by ownership relationships. Colors indicate (A) country of incorporation, and (B) type of entity. Node size indicates turnover reported by the entity.
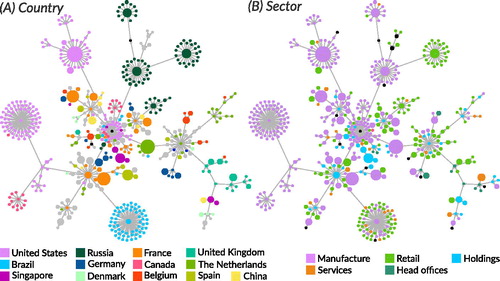
Figure 3. Visualization of our results. (A) Example of the interquartile range (IQR) and the color scheme used throughout the analysis. (B) Example of the FDI stock by country using two normalization strategies. Note that the outliers (Malta and Cyprus) reduce the range of countries visible with the StandardScaler strategy.
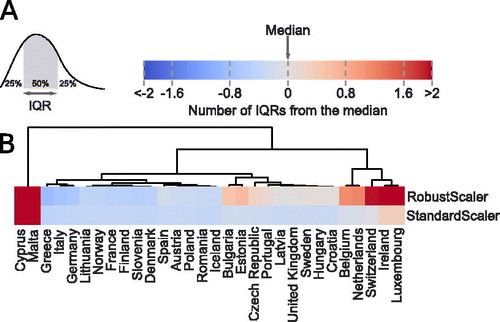
Figure 4. Manufacturing affiliates. (A) Activity indicators, (B) benefits, and (C) macro-institutional features and tax incentives associated with attracting manufacturing affiliates. The identified clusters of countries is marked with a gray bracket (A,C) and different shades of orange (B). See Table A1 for a complete explanation of the indicators. Countries are sorted according to their assigned cluster.
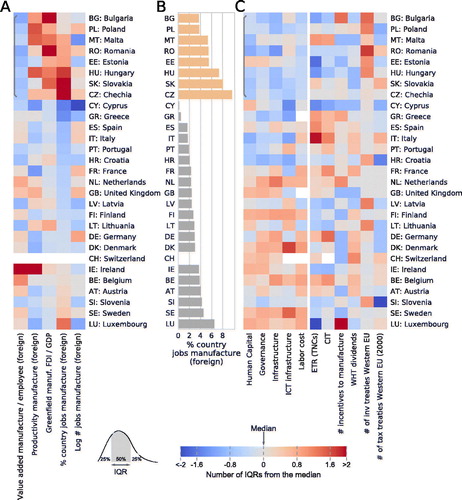
Figure 5. Shared service centers. (A) Activity indicators, (B) benefits, and (C) macro-institutional features and tax incentives associated with attracting shared service centers. The three identified clusters of countries are marked with gray brackets (A,C) and different shades of orange (B). See Table A1 for a complete explanation of the indicators. Countries are sorted according to their assigned cluster.
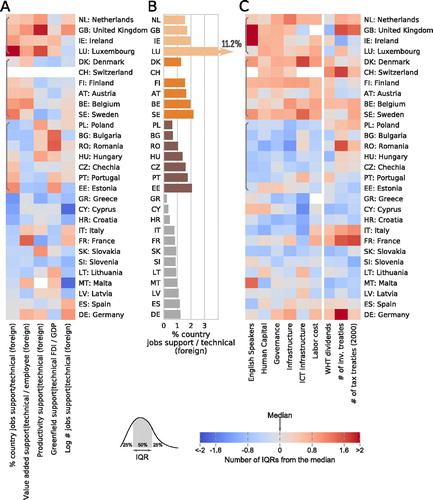
Figure 6. R&D facilities. (A) Activity indicators, (B) benefits, and (C) macro-institutional features and tax incentives associated with attracting R&D facilities.The two identified clusters of countries are marked with gray brackets (A,C) and different shades of orange. See Table A1 for a complete explanation of the indicators. Countries are sorted according to their assigned cluster.
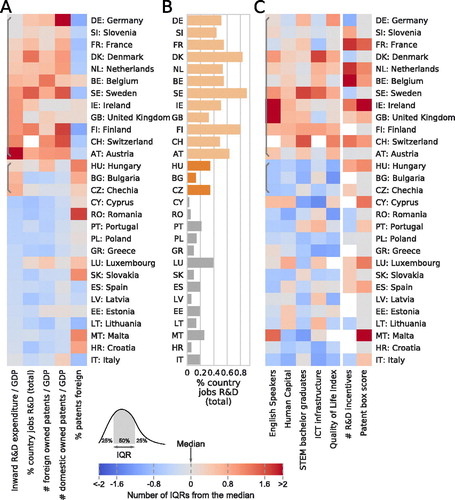
Figure 7. Top holdings. (A) Activity indicators, (B) benefits, and (C) macro-institutional features and tax incentives associated with attracting top holdings. The three identified clusters of countries are marked with gray brackets (A,C) and different shades of orange. See Table A1 for a complete explanation of the indicators. Countries are sorted according to their assigned cluster.
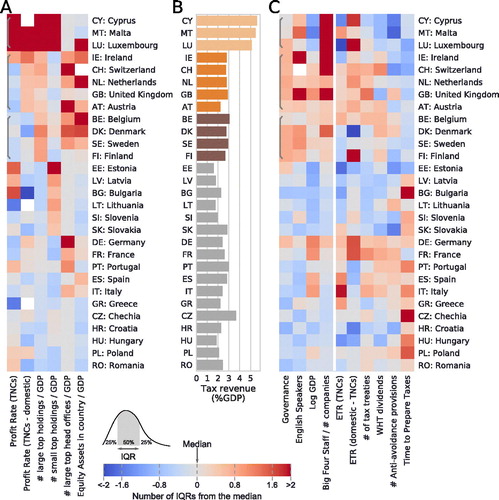
Figure 8. Intermediate holdings. (A) Activity indicators, (B) benefits, and (C) macro-institutional features and tax incentives associated with attracting intermediate holdings. The two identified clusters of countries are marked with gray brackets (A,C) and different shades of orange. See Table A1 for a complete explanation of the indicators. Countries are sorted according to their assigned cluster.
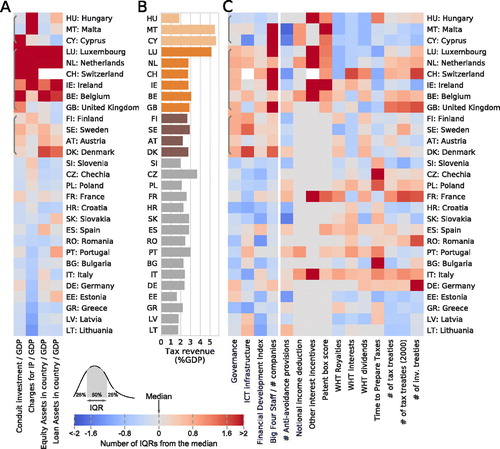
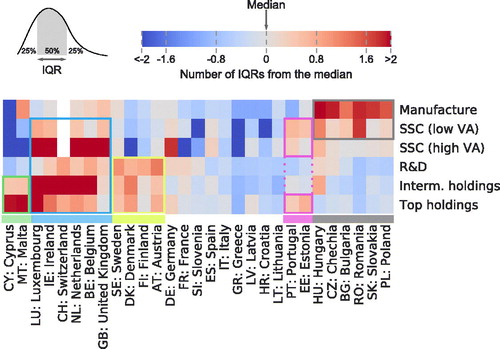
Figure 9. Summary of the results. Countries’ ability to attract different category of FDI. Red cells correspond to highly successful, blue cells correspond to highly unsuccessful. Colored boxes indicate the five FDI-attraction profiles identified: Profit centers (green), Coordination centers (blue), Innovation centers (yellow), Back-office centers (magenta) and Manufacturing centers (gray).