
Figures & data
Table 1. Macroeconomic performance, 2000-2007 and 2008-2017.
Table 2. Growth contributions of exports and imports, 2000-2007 and 2008-2017.
Table 3. Overview of key growth drivers.
Figure 1. House prices and GNI growth (upper panel), house prices and household debt (lower panel); before and after 2008.
Data sources: OECD, BIS; authors' calculations. See Supplementary material, Table A1, for data definitions and data restrictions.
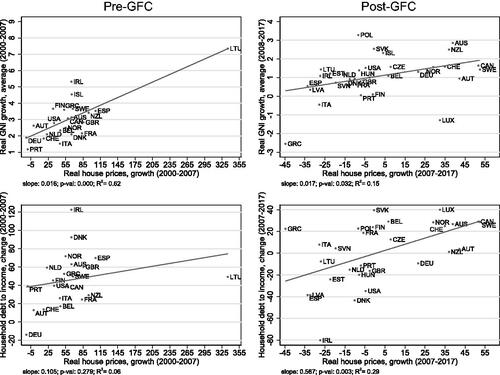
Figure 2. The financial cycle: change in household debt before and after 2008.
Data sources: OECD, BIS; authors’ calculations. See Supplementary material, .
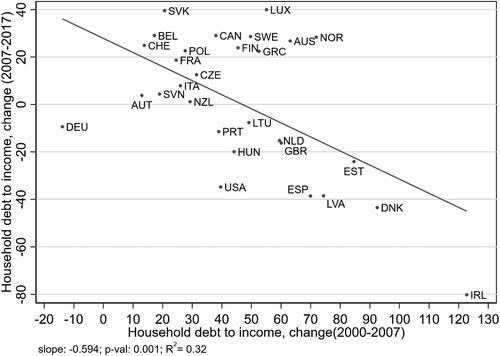
Figure 3. Cyclically adjusted fiscal balance (to potential output) and GNI growth, 2000-2007 and 2008-2017.
Data source: IMF; authors’ calculations. See Supplementary material, .
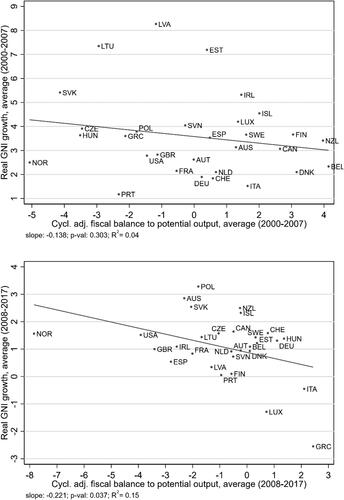
Figure 4. Growth of real effective exchange rate in manufacturing (REERMANUF) and average GNI growth rate, before and after 2008.
Data source: OECD; authors’ calculations; See Supplementary material, .
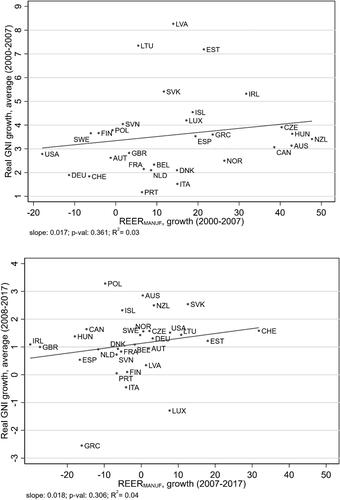
Figure 5. Export complexity index (ECI) and GNI growth, 2000-2007 and 2008-2017.
Data source: OEC; authors’ calculations. See Supplementary material, .
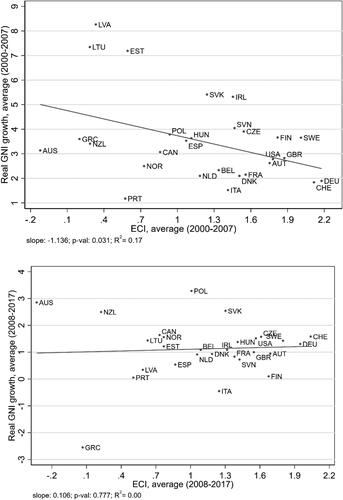
Table 4. Multivariate regression.