
Figures & data
Table 1. Governments led by members of the São Paulo Forum – 1995–2017.
Figure 1. Normalized level of capital controls – Latin America – unweighted country shares – 1995–2017.
Source: the author based on Fernandez et al. (Citation2016); Chinn and Ito (Citation2006, Citation2008).
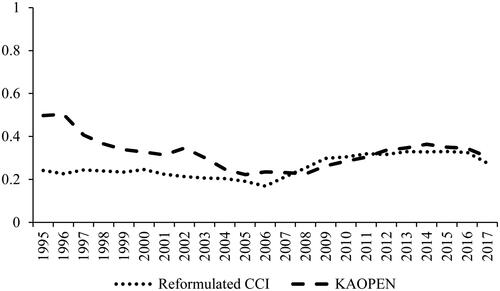
Table 2. Descriptive statistics.
Table 3. Baseline model.
Table 4. Model with the interaction between post-neoliberal governments and economic interests.
Table 5. Model with the duration of post-neoliberal governments.
Table 6. Model with governments led by members of the socialist international.
Supplemental material
Supplemental Material
Download PDF (204.2 KB)Data availability statement
The author confirms that the data supporting the findings of this study are available within the article or its supplementary materials.