
Figures & data
Figure 1. Alternative causal pathways linking trade shocks and candidate selection.
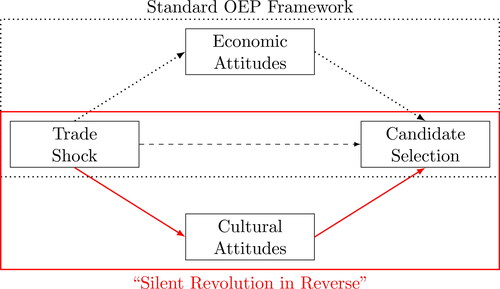
Figure 2. Congressional district exposure to Chinese import competition (1991–2016).
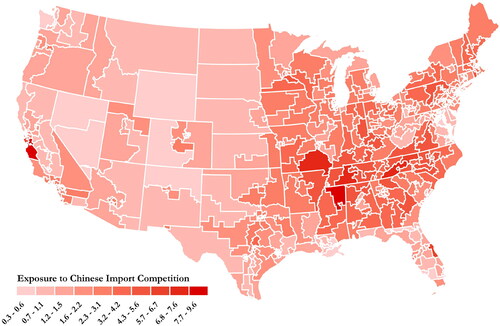
Table 1. Import exposure and sentiments towards ethnic and racial minorities.
Table 3. Heterogeneity by individual gender identity.
Figure 3. Import exposure and attitudes towards religious groups and sexual minorities.
Notes: This coefficient plot illustrates the estimated effects of district-level exposure to import competition on sentiments towards religious out-groups and in-groups in the left-hand panel, and opinions about sexual minorities in the right-hand panel. The leftmost (lightest) points of each triplet are TSLS estimates from models with no controls; middle points are TSLS estimates from models controlling for gender, age, education, race, and ethnicity; rightmost (darkest) points are TSLS estimates from models including the full set of controls used in . All models allow for election year fixed effects. Observations are weighted by ANES sampling weights. Standard errors are clustered at the district-year level. 95% confidence intervals are indicated with thin bars, while 90% intervals are indicated with thick bars.
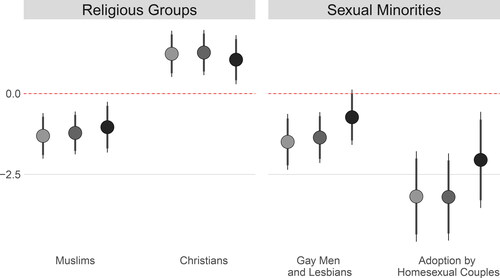
Figure 4. Import exposure and attitudes towards trade and redistribution.
Notes: This coefficient plot illustrates the estimated effects of district-level exposure to import competition on sentiments towards international trade in the left-hand panel, and opinions about redistribution in the right-hand panel. The leftmost (lightest) points of each triplet are TSLS estimates from models with no controls; middle points are TSLS estimates from models controlling for gender, age, education, race, and ethnicity; rightmost (darkest) points are TSLS estimates from models including the full set of controls used in . All models allow for election year fixed effects. Observations are weighted by ANES sampling weights. Standard errors are clustered at the district-year level. 95% confidence intervals are indicated with thin bars, while 90% intervals are indicated with thick bars.
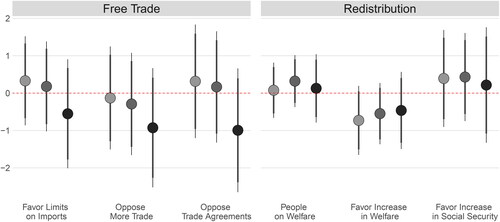
Table 2. Heterogeneity by individual race and ethnicity.