
Figures & data
Table 1. Comparing the geopolitical and geoeconomic approaches to foreign state investment.
Figure 1. Illustration of the geopolitical (A) and geoeconomic (B) perspective. Each node is a state as owner, each tie represents total investment into another state (A) or cluster (B). Node size approximates total investment by a state, tie thickness approximates amount of the respective investment into a state (A) or cluster (B). (B) contains only states as owners (and not other actors) for representational reasons.
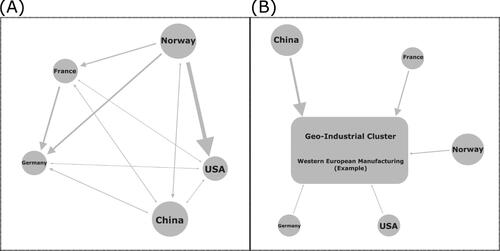
Table 2. Top 10 sectors of total transnational state capital.
Figure 2. The range and frequency of the Gini-coefficients of the top 31 clusters analyzed in this paper.
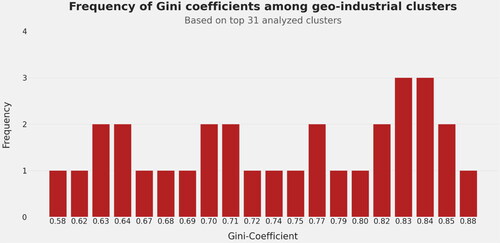
Figure 3. Top 20 owners and their investment of transnational state capital in different regions. The left numbers are the total investment by each state, the right the total inflows in each region (in US Dollars). The node size reflects outflows (states) and inflows (regions). The color of the edges reflects the destination (region) of the investment.
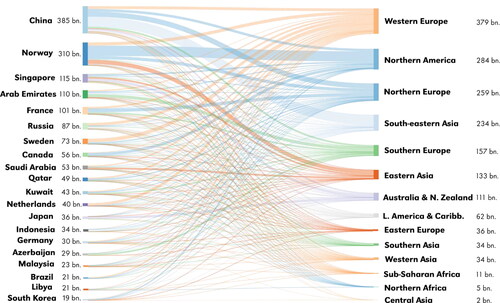
Figure 4. Concentration of transnational state capital in different geo-industrial clusters, in percent. The percentages are to be read row-wise. Darker color indicates a higher percentage of absolute investment in the respective cluster. Each cell represents one geo-industrial cluster.
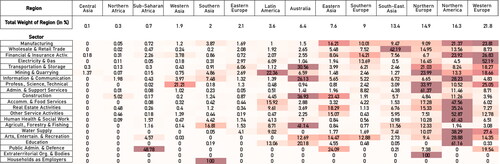
Figure 5. Southern European manufacturing cluster.
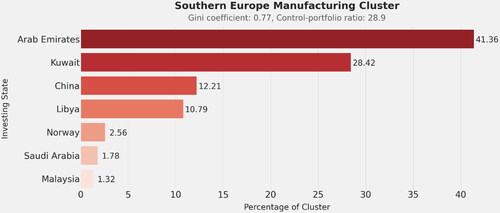
Figure 6. Southern European electricity and gas cluster.
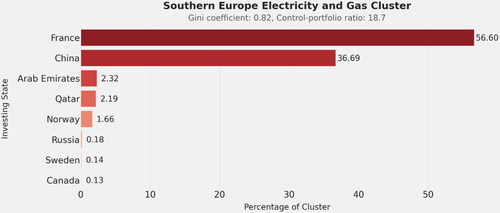
Figure 7. Northern European transportation and storage cluster.
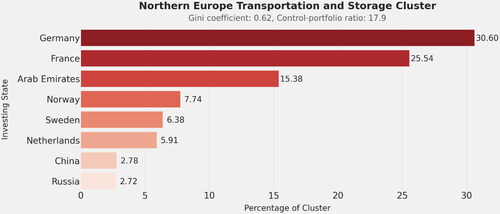
Figure 8. Northern American mining and quarrying cluster.
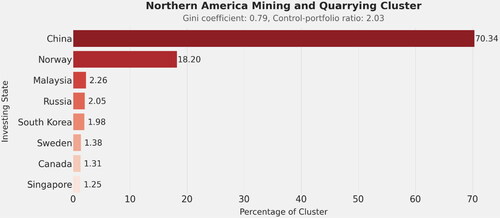
Figure 9. Western European manufacturing cluster.
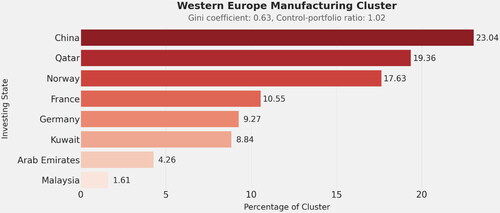
Figure 10. Western European electricity and gas cluster.
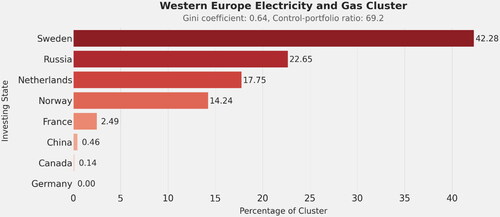
Figure 11. Western European transportation and storage cluster.
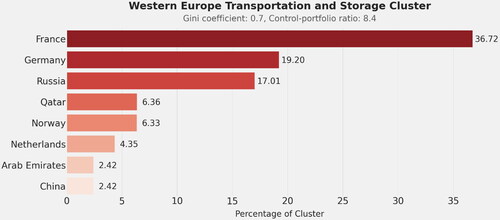
Table 3. Control-portfolio ratios and Gini coefficients for all geographical areas. Sorted descending by total state investment.
Supplemental Material
Download PDF (576.2 KB)Data availability statement
The data that support the findings of this study are available from Bureau van Dijk’s ORBIS database (https://www.bvdinfo.com/). Restrictions apply to the availability of these data, which were used under license for this study. Data are available from the author with the permission of Bureau van Dijk. The nationally aggregated and processed data as well as more supplementary material and the Python script are freely available at the Open Science Framework at https://osf.io/rkx7e/?view_only=2759b4b447204420b1353c62e7a6febe.