Figures & data
Figure 1. FDI stock in Sudan, 1990-2009 (in millions of US Dollars at current prices on 9th April 2019).
Source: UNCTAD (n.d.).
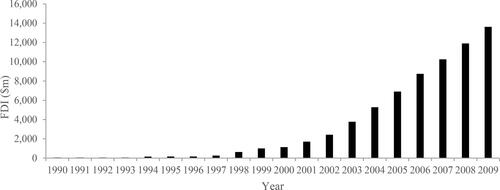
Figure 2. Annual oil production in Sudan, 1993–2010.
Source: BP. (Citation2019).
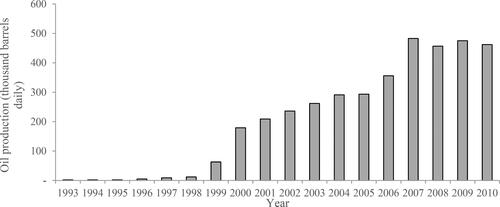
Table 1. Inward FDI stock, average annual increase of FDI stock ($million) between 1995-2005 and oil production in the smaller oil producing countries of the Global South (<500,000 bpd).
Figure 3. Annual BRDs in Sudan, 1989-2009 (BRDs best estimate).
Source: Pettersson et al. (Citation2019).
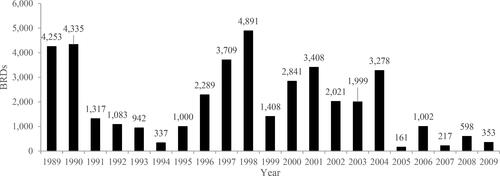
Table 2. Key oil areas of Unity State, Greater Upper Nile.
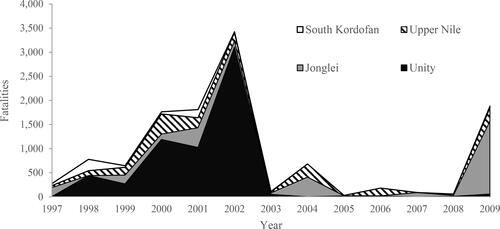
Figure 4. Fatalities in Sudan (top 8 regions by fatalities), 1997-2009.
Source: Raleigh et al. (Citation2010).
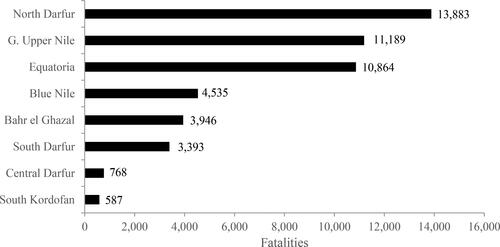
Figure 5. Fatalities in Greater Upper Nile, 1997-2009.
Source: Raleigh et al. (Citation2010).
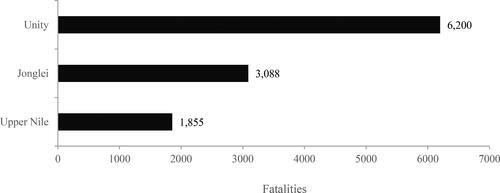
Figure 6. Annual fatalities in Greater Upper Nile (top 3 regions by fatalities) and South Kordofan, 1997-2009.
Source: Raleigh et al. (Citation2010).