
Figures & data
Table 1. Strategic options of Germany’s foreign economic policy towards China.
Table 2. Forbes Global 2000 National Profit Shares in Key Sectors, 2019.
Table 3. Expected sectoral support for NIS 2030, ranked highest to lowest.
Figure 1. German exports to China, percentage of combined exports to France and US, by sector.
Source: UN Comtrade; VDMA (various annual issues) Maschinenbau in Zahl und Bild
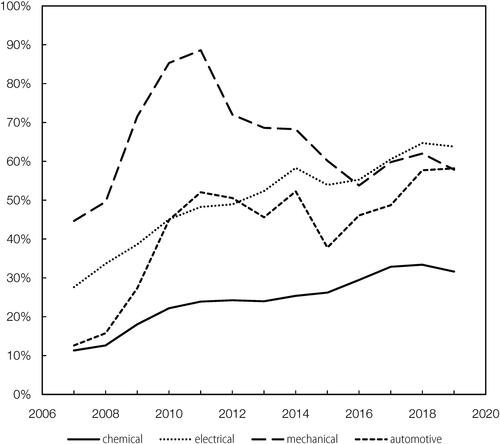
Figure 2. Host country share of German FDI by investing sector, 2019.
Source: Deutsche Bundesbank (2022) Direktinvestitionsstatistiken: Statistische Fachreihe.
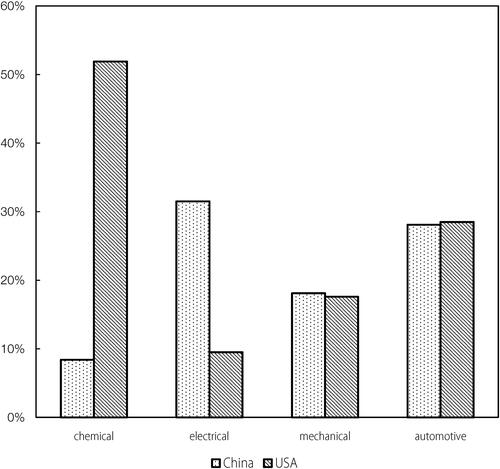
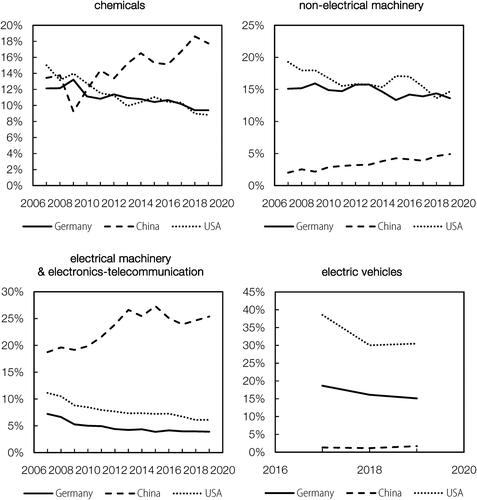
Figure 3. Country share in global ‘high-tech’ exports, by product.
Note: Calculations based on the classification and aggregation of ‘high-technology’ product groups used by Eurostat (dividing research and development expenditure by total sales) in its indicators on high-tech industry and knowledge-intensive services (https://ec.europa.eu/eurostat/statistics-explained/index.php?title=Archive:High-tech_statistics_-_economic_data#Trade_in_high-tech_products). For the automotive industry, the new product class (available since 2017) ‘motor vehicles powered by electric motors only’ (HS 870380) is used, as first calculated by Daniel Workman: http://www.worldstopexports.com/electric-cars-exports-by-country/
Source: UN Comtrade (SITC Rev. 4 & HS 2017)
Data availability statement
The primary data that support the findings of this study are derived from resources available in the public domain. URLs to the original source are provided.