
Figures & data
Table 1. Institutional logics and patterns of cross-border financial integration.
Table 2. Top-50 largest banks globally (% of assets).
Figure 1. Non-US banks’ US dollar-denominated claims (USD trillion).
Source: BIS locational banking statistics.
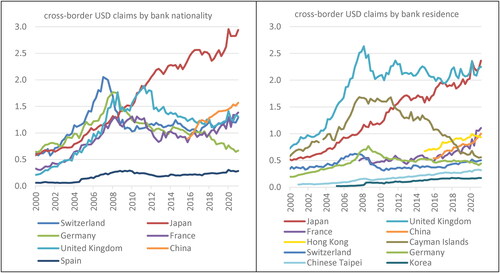
Figure 2. Investments in Foreign Securities by Insurance Companies and Pension Funds (USD trillion).
Source: Central bank websites.
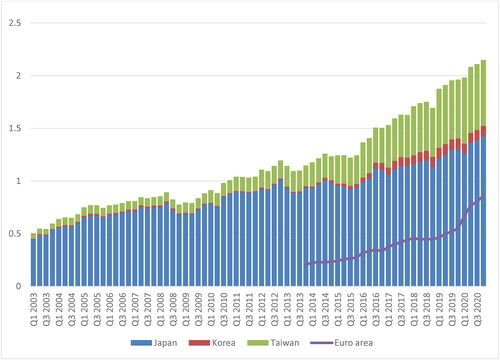
Figure 3. Rising global share of Asian capital markets.
Sources: FIA, WFE.
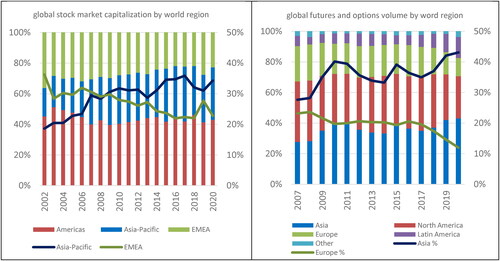
Table 3. The rise of Asian financial centers.
Figure 4. Relative performance of Asian and European stock markets.
Source: MSCI index data via Bloomberg.
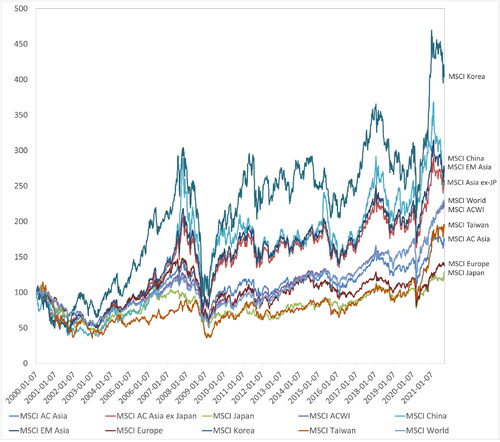
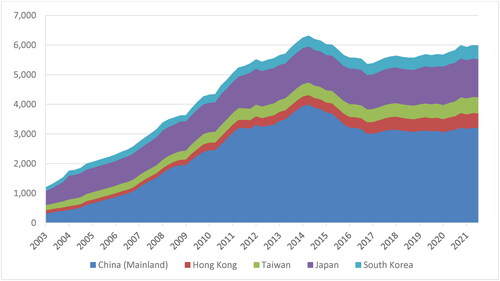
Figure 5. FX reserves by East Asian countries (in billion USD; 2003-2021).
Source: Bloomberg Terminal.
Supplemental material