
Figures & data
Figure 1. Growth in global value of mobile money transactions. Source: Author drawings from GSMA data (GSMA, Citation2021, Citation2022).
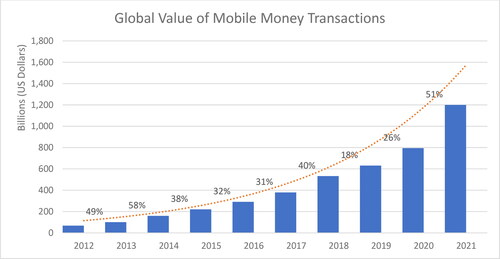
Table 1. Distribution of mobile money Statistics in Africa for 2020.
Figure 2. Growth in the value of mobile money transactions in Ghana (2012–2021). Source: Bank of Ghana (Citation2020, Citation2021).
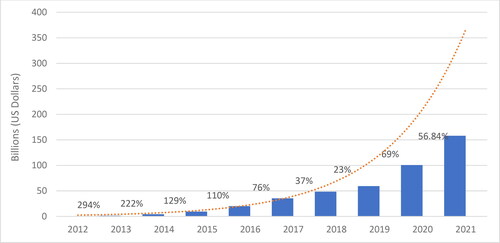
Table 2. Mobile money Statistics in Ghana (2012–2022).
Table 3. Comparison of mobile money fees and tariffs by operators.
Table 4. Impact of e-levy on transaction cost.
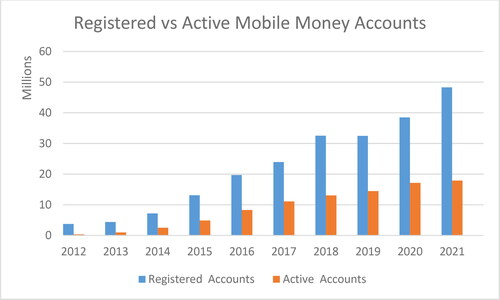
Figure 3. Registered vs active MM accounts in Ghana (2012–2022). Source: Bank of Ghana (Citation2020, Citation2021, Citation2022).
Supplemental material