4,686
Views
0
CrossRef citations to date
0
Altmetric
Research Articles

Exploring the roles of academic self-concept and perseverance of effort in self-assessment practices

ORCID Icon, ORCID Icon, , &
Pages 104-129 | Received 22 Jul 2022, Accepted 04 Mar 2023, Published online: 15 Mar 2023

Figures & data

Figure 1. The self-system processes model of motivation prepared by the authors based on Connell and Wellborn (Citation1991) and existing literature of the variables included in this study.

Note. In drawing the arrows from the three research lines (self-assessment, academic self-concept and grit) to learning outcomes, we referred to previous findings in signature research work documented in the three research lines: a) the monograph on the link between self-assessment and learning enhancement (Boud, Citation1992, Citation1995); b) the classic review on the multidimensional and hierarchical construct of self-concept (Shavelson et al., Citation1976) and c) the first paper on grit as individuals’ passion and perseverance of effort for pursuing long-term goals (A. L. Duckworth et al., Citation2007), respectively. These paths examined in the previous research are expressed in solid lines, whereas those tested in this study are indicated via dashed lines. H1 denotes the perseverance of effort facet of grit will positively predict students’ self-assessment practice in learning situations; H2 denotes the perseverance of effort facet of grit will positively predict students’ perceptions of competence and affect self-concepts in learning situations and H3 denotes students’ perceptions will mediate the relationship between the perseverance of effort facet of grit and SA practice.
Figure 1. The self-system processes model of motivation prepared by the authors based on Connell and Wellborn (Citation1991) and existing literature of the variables included in this study.

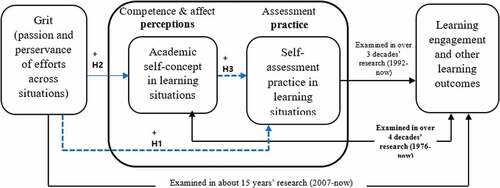
Table 1. Summary of key features of the three variables and conceptual links.

Figure 2. Path model 1 to test the predictive effects of Grit-PE and ASC on SA.

Figure 2. Path model 1 to test the predictive effects of Grit-PE and ASC on SA.

Figure 3. Path model 2 to test the predictive effects of Grit-PE and the two aspects of ASC on SA.

Figure 3. Path model 2 to test the predictive effects of Grit-PE and the two aspects of ASC on SA.

Table 2. Descriptive statistics, reliabilities and correlations among the variables.

Table 3. Bootstrap analysis on mediation effects.

Table 4. Psychometric indicators for the three subscales of SaPS based on CFA and Rasch analyses.

Table A1. Fit indices for the measurement of the scales.

Table A2. Items of these scales used in the current study with means, SDs and factor loadings.

Table A3. Bootstrap analysis on mediation effects.

Table A4. Fit indices for these models (see ) in the supplementary analyses.