Figures & data
Table 1. Characteristics of respondents (N = 90).
Figure 1. Frequency of interactions between respondents and patients with life-limiting illnesses (N = 89).
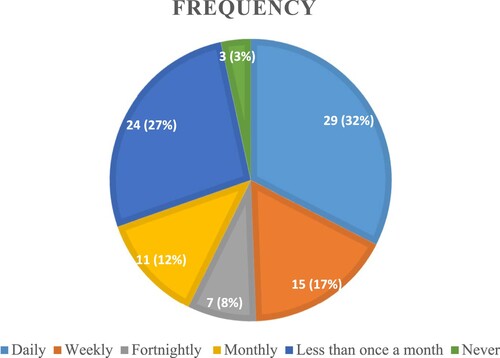
Table 2. Attitudes and beliefs questions (N = 90).
Table 3. Self-rated competency levels based on HSE’s Palliative Care Competency framework (N = 90).
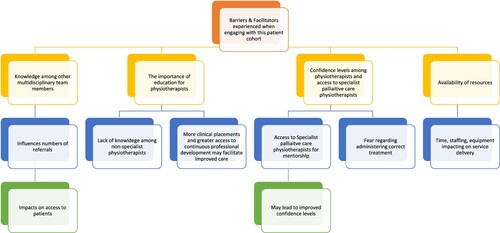
Figure 2. Thematic map; barriers and facilitators to providing good quality care.