Figures & data
Figure 1. (A) Histogram of non-washed spleen leucocytes from commercial group after incubation. We observe two picks of cells. Stained cells (H) and not-stained cells (on the left, not-gated). (B) Histogram of washed spleen leucocytes from commercial group after incubation. We observe two picks of cells. Stained cells (H) and not-stained cells (on the left). No differences between (A) and (B) are observed.
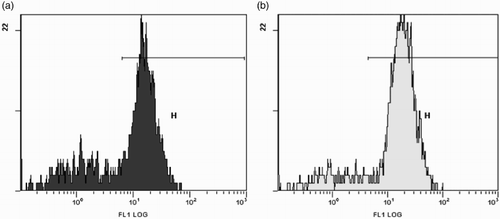
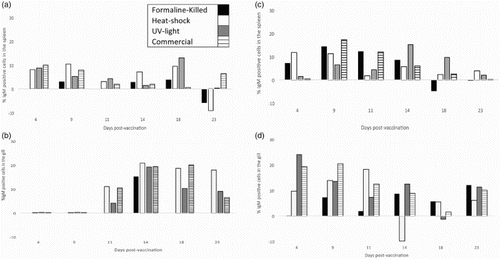
Figure 2. Percentages of IgM-positive cells in the gill and spleen of vaccinated fish. Values expressed as increment above control.