3,162
Views
21
CrossRef citations to date
0
Altmetric
Original Articles

Effect of starvation on some immunological and biochemical parameters in tinfoil barb (Barbonymus schwanenfeldii)

, , &
Pages 173-178 | Received 14 Jun 2014, Accepted 21 Oct 2015, Published online: 04 Feb 2016

Figures & data

Figure 1. Plasma natural haemolytic complement activity (ACH50) of tinfoil barb (Barbonymus schwanenfeldii) Control: fed two times daily to apparent satiation; S1: deprivation for 1 week; S2: deprivation for 2 weeks. Different superscripts on each column indicate significant difference between feeding strategies (P < .05).
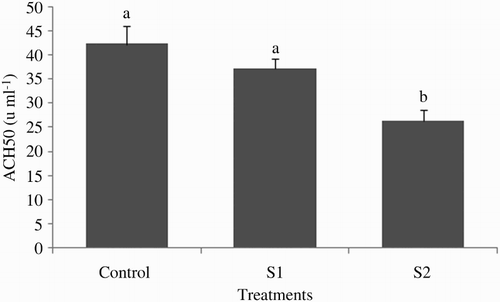
Figure 1. Plasma natural haemolytic complement activity (ACH50) of tinfoil barb (Barbonymus schwanenfeldii) Control: fed two times daily to apparent satiation; S1: deprivation for 1 week; S2: deprivation for 2 weeks. Different superscripts on each column indicate significant difference between feeding strategies (P < .05).
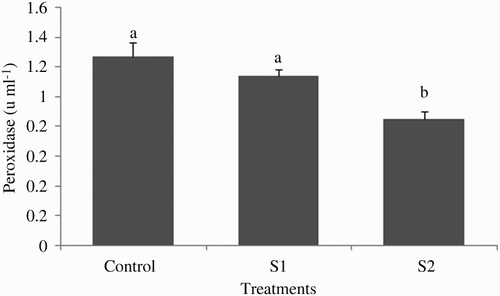
Figure 2. Plasma peroxidase activity of tinfoil barb (Barbonymus schwanenfeldii) Control: fed two times daily to apparent satiation; S1: dprivation for 1 week; S2: deprivation for 2 weeks. Different superscripts on each column indicate significant difference between feeding strategies (P < .05).

Figure 2. Plasma peroxidase activity of tinfoil barb (Barbonymus schwanenfeldii) Control: fed two times daily to apparent satiation; S1: dprivation for 1 week; S2: deprivation for 2 weeks. Different superscripts on each column indicate significant difference between feeding strategies (P < .05).

Figure 3. Plasma trypsin inhibition activity of tinfoil barb (Barbonymus schwanenfeldii) Control: fed two times daily to apparent satiation; S1: deprivation for 1 week; S2: deprivation for 2 weeks. No significant difference (P > .05) was observed between treatments.
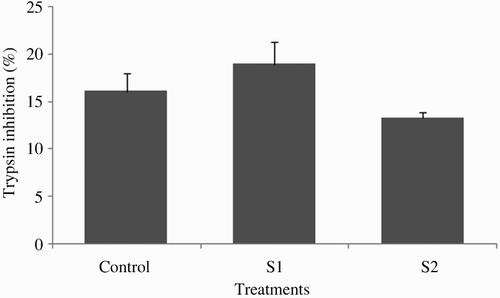
Figure 3. Plasma trypsin inhibition activity of tinfoil barb (Barbonymus schwanenfeldii) Control: fed two times daily to apparent satiation; S1: deprivation for 1 week; S2: deprivation for 2 weeks. No significant difference (P > .05) was observed between treatments.

Figure 4. Plasma lysozyme activity of tinfoil barb (Barbonymus schwanenfeldii) Control: fed two times daily to apparent satiation; S1: deprivation for 1 week; S2: deprivation for 2 weeks. Different superscripts on each column indicate significant difference between feeding strategies (P < .05).
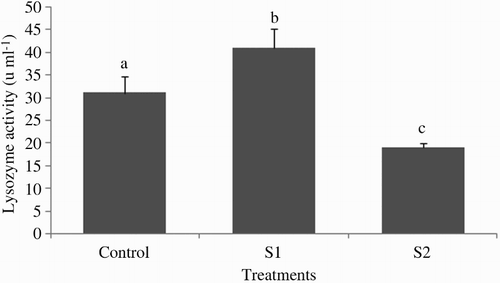
Figure 4. Plasma lysozyme activity of tinfoil barb (Barbonymus schwanenfeldii) Control: fed two times daily to apparent satiation; S1: deprivation for 1 week; S2: deprivation for 2 weeks. Different superscripts on each column indicate significant difference between feeding strategies (P < .05).
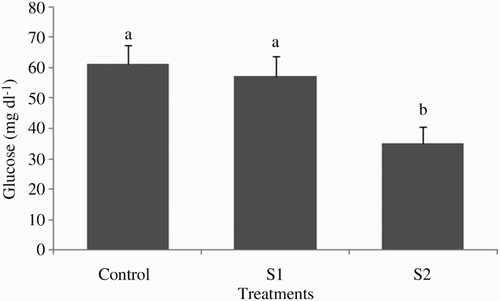
Figure 5. Plasma glucose levels of tinfoil barb (Barbonymus schwanenfeldii) measured in starved groups and control group (mean ± SE). Control: fed two times daily to apparent satiation; S1: deprivation for 1 week; S2: deprivation for 2 weeks. Different superscripts on each column indicate significant difference between feeding strategies (P < .05).

Figure 5. Plasma glucose levels of tinfoil barb (Barbonymus schwanenfeldii) measured in starved groups and control group (mean ± SE). Control: fed two times daily to apparent satiation; S1: deprivation for 1 week; S2: deprivation for 2 weeks. Different superscripts on each column indicate significant difference between feeding strategies (P < .05).

Table 1. Biochemical parameters of tinfoil barb (Barbonymus schwanenfeldii) measured in starved groups and control group (mean ± SE).