Figures & data
Table 1. Primer information used in this study.
Figure 1. Multiple sequence alignments for COI sequences determined in this study. Majority of pigs have two types of DNA sequences (Pig01 and Pig02), but most chickens showed an identical sequence (chicken). Two types of fish meat sources were found from cod and pollock. The underlined sequences indicate the primer sequences for the universal primer set.
Figure 2. PCR amplification patterns in sausage DNA samples. (A) A universal primer set 3sp_COI_F and 3sp_COI_R; (B) pig-specific Pig_CYTB_F and CYTB_R; (C) chicken-specific Gal_CYTB_F and Gal_CYTB_R; (D) fish-specific Fish_mtF and Fish_mtR. + and − indicate the presence and absence of the meat product on the labels of the sausages, respectively. M1 and M2 are DNA size markers, 50-bp and 100-bp ladder, respectively.
Figure 3. Real-time PCR amplification patterns of pig, chicken, and fish meat. (A–C) show amplification patterns for serial dilutions of pig (A), chicken (B), and fish meat (C). (D–F) show the standard curves for (A–C).
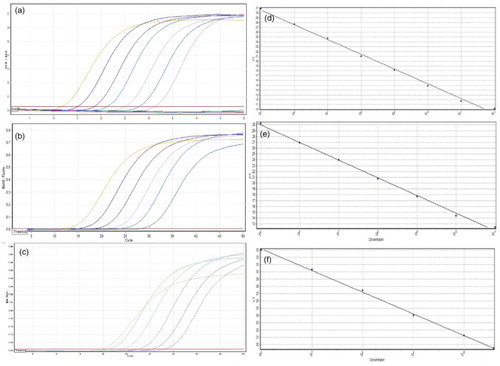
Figure 4. Electrophoresis analysis for real-time PCR products. (A) pig; (B) chicken; (C) fish meat. M is DNA size marker, 100-bp ladder. Numbers on top of the lanes indicate DNA concentrations in 1 μl solution used for PCR amplification.