
Figures & data
Table 1. Simulated traits, their means, standard deviations, EVs and age effects.
Table 2. Genotypic and phenotypic correlations between traits used in the model (Khan, Citation2009).
Table 3. Population biological and technical parameters for the simulation study.
Table 4. Mean and standard error (se) of genetic gain (Δg) in US$ per year and R2 value of milk traits, liveweight and longevity of the simulated cow population under PAT and PT selection schemes with a selection objective for milk merit.
Table 5. Mean and standard error (se) of genetic gain (Δg) in US$ per year and R2 value of milk traits, liveweight and longevity of the simulated bull population under PAT and PT selection schemes with a selection objective for milk merit.
Figure 1. Average economic merit with standard deviation (bar) for milk yield under PAT and PT breeding scheme with different selection objectives for all cows born in a particular year.
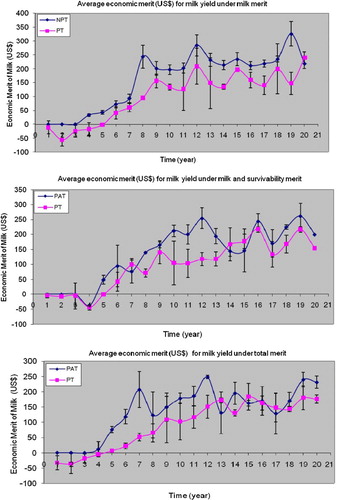
Table 6. Correlated response (CRY) with longevity and other traits in consideration of two breeding schemes within three selection objectives.
Supplemental material