Figures & data
Figure 1. The means of SGR for all experimental groups over the course of the experiment.
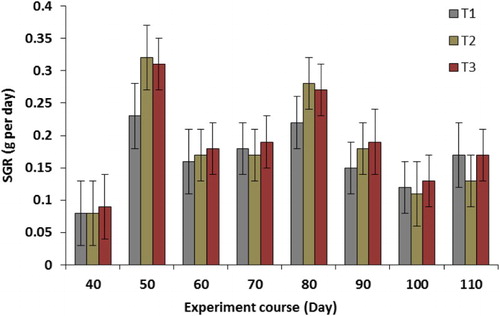
Figure 2. The total shrimp biomass after 120 days rearing for all experimental groups. Means with different superscripts are significantly different (P < 0.05).
Figure 3. The mean weight of each shrimp during 120 days rearing for all experimental groups. Means with different superscripts are significantly different (P < 0.05).
Figure 4. The values of mean FCR during 120 days rearing for all experimental groups. Means with different superscripts are significantly different (P < 0.05).
Figure 5. The values of SR during 120 days rearing for all experimental groups. Means with different superscripts are significantly different (P < 0.05).
Figure 6. The mean values of water NH3 during 120 days rearing for all experimental groups. Means with different superscripts are significantly different (P < 0.05).
Figure 7. The mean values of water TOM % during 120 days rearing for all experimental groups. Means with different superscripts are significantly different (P < 0.05).
Figure 8. The mean values of water BOD5 during 120 days rearing for all experimental groups. Means with different superscripts are significantly different (P < 0.05).