Figures & data
Table 1. Lethal concentrations (LC1–99) of nickel (mean ± standard error) depending on time (24–96 h) for goldfish@@@.
Figure 1. The activities of SOD, CAT and GPx in the liver of Carassius auratus with exposure to nickel sub-acute concentrations for 7 days. Values are mean ± SD of 10 fish. The significance level is p < .05.
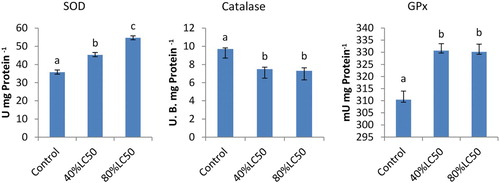
Figure 2. The activities of the Aspartate aminotransferase (AST) enzyme in the plasma of Carassius auratus with exposure to nickel sub-acute concentrations for 7 days. Values are mean ± SD of 10 fish. The significance level is p < .05.
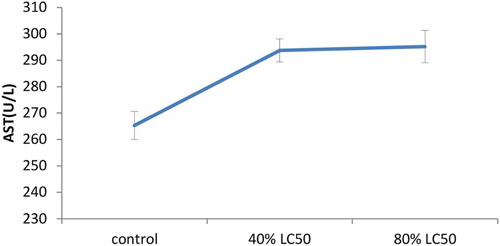
Figure 3. The activities of the alkaline phosphatase (ALP) enzyme in the plasma of Carassius auratus with exposure to nickel sub-acute concentrations for 7 days. Values are mean ± SD of 10 fish. The significance level is p < .05.
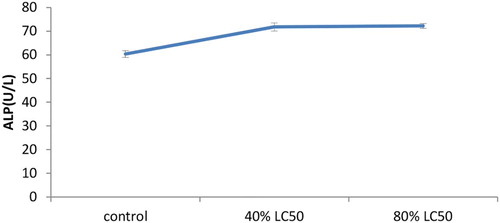
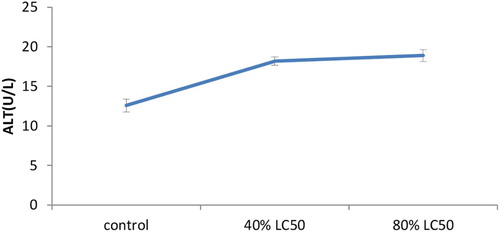
Figure 4. The activities of the Alanine aminotransferase (ALT) enzyme in the plasma of Carassius auratus with exposure to nickel sub-acute concentrations for 7 days. Values are mean ± SD of 10 fish. The significance level is p < .05.