Figures & data
Table 1. Mean values of meteorological parameters during the cold-dry (CDS), hot-dry (HDS) and rainy (RAS) seasons.
Figure 1. Mean (±SEM) values of respiratory rate of T4 in adult bucks of RSG and SHG during the cold-dry, hot-dry and rainy seasons (n = 10). RSG – Red Sokoto goats; SHG – Sahel goats. Bars with different alphabets are statistically significant (P < .05). x,y: between seasons, a,b between breeds.
Figure 2. Mean (±SEM) values of pulse rate in bucks of RSG and SHG during the cold-dry, hot-dry and rainy seasons (n = 10). RSG – Red Sokoto goats; SHG – Sahel goats. Bars with different alphabets are statistically significant (P < .05). x,y: between seasons, a,b: between breeds.
Figure 3. Mean (±SEM) values of rectal temperature in bucks of RSG and SHG during the cold-dry, hot-dry and rainy seasons (n = 10). RSG – Red Sokoto goats; SHG – Sahel goats. Bars with different alphabets are statistically significant (P < .05). x,y: between seasons, a,b between breeds.
Table 2. Seasonal changes in haematological parameters of male Red Sokoto and Sahel goats.
Figure 4. Mean (±SEM) values of percentage haemolysis at 0.1% NaCl in bucks of RSG and SHG during the cold-dry, hot-dry and rainy seasons (n = 10). RSG – Red Sokoto goats; SHG – Sahel goats. Bars with different alphabets are statistically significant (P < .05). x,y: between seasons.
Figure 5. Mean (±SEM) values of percentage haemolysis at 0.3% NaCl in bucks of RSG and SHG during the cold-dry, hot-dry and rainy seasons (n = 10). RSG – Red Sokoto goats; SHG – Sahel goats.
Figure 6. Mean (±SEM) values of percentage haemolysis at 0.5% NaCl in bucks of RSG and SHG during the cold-dry, hot-dry and rainy seasons (n = 10). RSG – Red Sokoto goats and SHG – Sahel goats. Bars with different alphabets are statistically significant (P < .05). x,y: between seasons.
Figure 7. Mean (±SEM) values of percentage haemolysis at 0.7% NaCl in bucks of RSG and SHG during the cold-dry, hot-dry and rainy seasons (n = 10). RSG – Red Sokoto goats; SHG – Sahel goats.
Figure 8. Mean (±SEM) serum concentration of T3 in bucks of RSG and SHG during the cold-dry, hot-dry and rainy seasons (n = 10). RSG – Red Sokoto goats; SHG – Sahel goats. Bars with different alphabets are statistically significant (P < .05). x,y: between seasons, a,b: between breeds.
Figure 9. Mean (±SEM) serum concentrations of T4 in bucks of RSG and SHG during the cold-dry, hot-dry and rainy seasons (n = 10). RSG – Red Sokoto goats; SHG – Sahel goats. Bars with different alphabets are statistically significant (P < .05). x,y: between seasons, a,b between breeds.
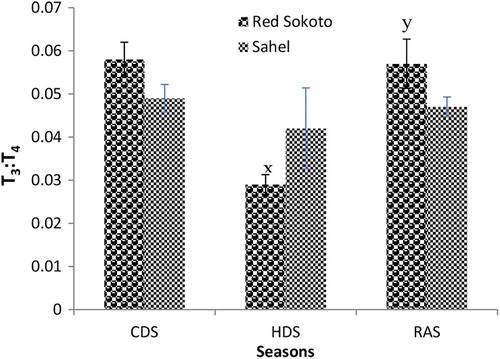
Figure 10. Mean (±SEM) values of T3:T4 in bucks of RSG and SHG during the cold-dry, hot-dry and rainy seasons (n = 10). RSG – Red Sokoto goats; SHG – Sahel goats. Bars with different alphabets are statistically significant (P < .05). x,y: between seasons.