1,267
Views
6
CrossRef citations to date
0
Altmetric
Articles

LCFA Uptake and FAT/CD36: molecular cloning, tissue expression and mRNA expression responses to dietary oil sources in grass carp (Ctenopharyngodon idellus)Footnote*

, , , , , , , & show all
Pages 572-582 | Received 15 Feb 2017, Accepted 26 Jul 2017, Published online: 10 Aug 2017

Figures & data

Figure 1. The hepatocytes incubating with (A) and without (B) QBT, observed in the microscope (×10).
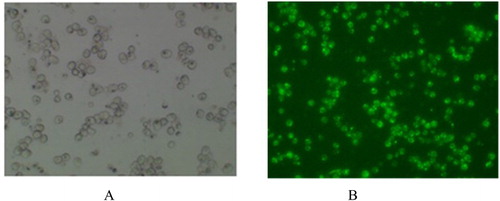
Figure 1. The hepatocytes incubating with (A) and without (B) QBT, observed in the microscope (×10).

Table 1. Primer sequence for molecular cloning and quantitative real-time PCR of FAT/CD36 in grass carp (C. idellus). All sequences are presented as 5′-3′.

Table 2. Composition and nutrient levels of the experimental diets (air-dry basis, %) for grass carp (C. idellus) used in the in vivo study.

Table 3. FA composition of diets (% of total FA) used in the in vivo study with grass carp (C. idellus).

Figure 2. Time-course uptake of LCFAs in hepatocytes determined by means of the QBT kit from grass carp (C. idellus).
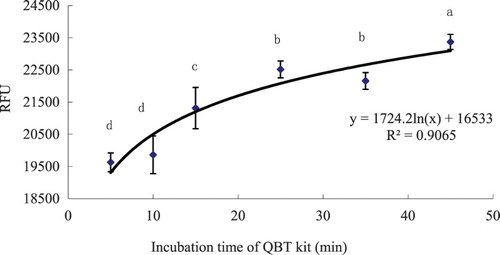
Figure 2. Time-course uptake of LCFAs in hepatocytes determined by means of the QBT kit from grass carp (C. idellus).

Figure 3. LCFA uptake depending on the OA concentration in hepatocytes from grass carp (C. idellus).
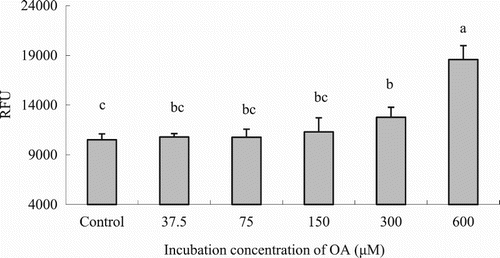
Figure 3. LCFA uptake depending on the OA concentration in hepatocytes from grass carp (C. idellus).

Figure 4. Effects of incubating time on LCFA uptake in hepatocytes from grass carp (C. idellus).

Figure 4. Effects of incubating time on LCFA uptake in hepatocytes from grass carp (C. idellus).

Figure 5. Effects of LCFA uptake depending on the type of FA in hepatocytes from grass carp (C. idellus).
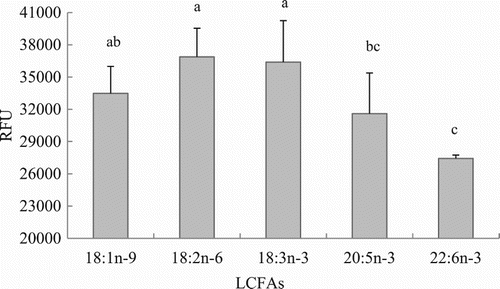
Figure 5. Effects of LCFA uptake depending on the type of FA in hepatocytes from grass carp (C. idellus).

Figure 6. Effects of non-specific inhibitors on LCFA uptake in hepatocytes from grass carp (C. idellus).
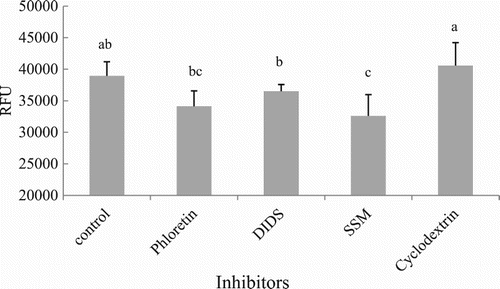
Figure 6. Effects of non-specific inhibitors on LCFA uptake in hepatocytes from grass carp (C. idellus).

Figure 7. Comparison of FAT/CD36 amino acids’ homology in grass carp (C. idellus), common carp (C. carpio) and zebrafish (D. rerio). The line of consensus shows the conserved residues of FAT/CD36 among these fish and these identical amino acid residues are shown in white words with black background. The trans-membrane domain of FAT/CD36 is boxed. The alignment was generated using vector DNAMAN software.
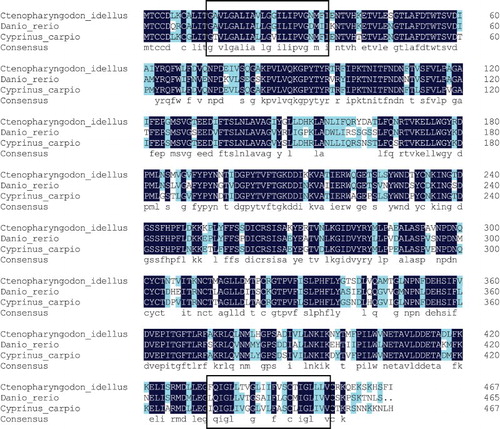
Figure 7. Comparison of FAT/CD36 amino acids’ homology in grass carp (C. idellus), common carp (C. carpio) and zebrafish (D. rerio). The line of consensus shows the conserved residues of FAT/CD36 among these fish and these identical amino acid residues are shown in white words with black background. The trans-membrane domain of FAT/CD36 is boxed. The alignment was generated using vector DNAMAN software.

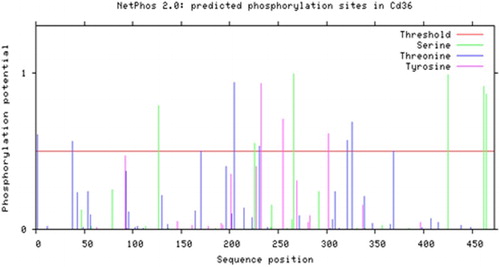
Figure 8. Phosphorylation sites predicted in FAT/CD36 protein.

Figure 8. Phosphorylation sites predicted in FAT/CD36 protein.

Figure 9. Secondary structure of FAT/CD36 protein is predicted. The domain of amino acids in blue line are α-helices, the domain of amino acids in red line are β-brands and the amino acids left in purple line are random coils.

Figure 9. Secondary structure of FAT/CD36 protein is predicted. The domain of amino acids in blue line are α-helices, the domain of amino acids in red line are β-brands and the amino acids left in purple line are random coils.

Figure 10. Three-dimensional model of FAT/CD36 shown by cartoon and surface models. This protein included many α-helices, β-brands and random coils. It was generafted by PHYRE2 Server.
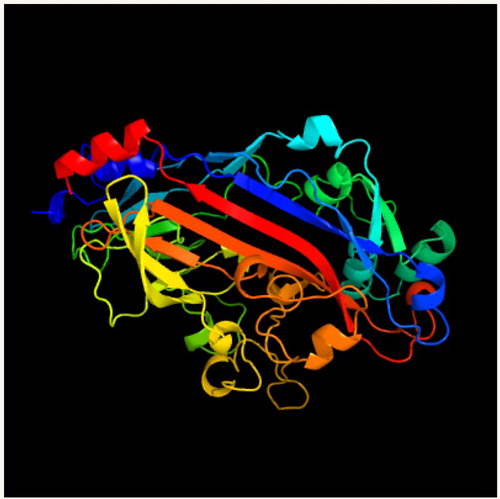
Figure 10. Three-dimensional model of FAT/CD36 shown by cartoon and surface models. This protein included many α-helices, β-brands and random coils. It was generafted by PHYRE2 Server.

Figure 11. Phylogenetic analysis of FAT/CD36. Phylogenetic tree based on protein sequences was constructed by the neighbour-joining method with Mega 5.0 software. The strength of branch relationships was assessed by bootstrap replication (N = 1000 replicates). Grass carp FAT/CD36 was indicated by ‘●’. Accession numbers of protein sequences for FAT/CD36 are as follows: Cyprinus carpio (KM030422); Danio rerio (NM_001002363); Homo sapiens (KR710356); Macaca mulatta (AY600441); Rattus norvegicus (NM_031561); Mus musculus (NM_001159558); Lipotes vexillifer (XM_007467039); Bos taurus (NM_001278621); Capra hircus (JF690773); Gallus gallus (NM_001030731); Xenopus (Silurana) tropicalis (NM_001113679).
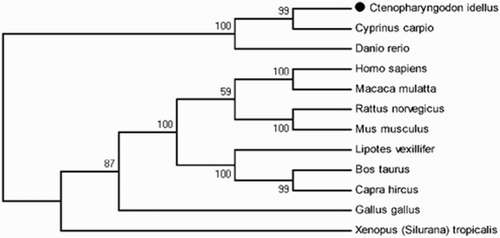
Figure 11. Phylogenetic analysis of FAT/CD36. Phylogenetic tree based on protein sequences was constructed by the neighbour-joining method with Mega 5.0 software. The strength of branch relationships was assessed by bootstrap replication (N = 1000 replicates). Grass carp FAT/CD36 was indicated by ‘●’. Accession numbers of protein sequences for FAT/CD36 are as follows: Cyprinus carpio (KM030422); Danio rerio (NM_001002363); Homo sapiens (KR710356); Macaca mulatta (AY600441); Rattus norvegicus (NM_031561); Mus musculus (NM_001159558); Lipotes vexillifer (XM_007467039); Bos taurus (NM_001278621); Capra hircus (JF690773); Gallus gallus (NM_001030731); Xenopus (Silurana) tropicalis (NM_001113679).
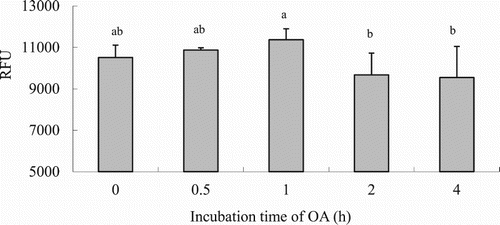
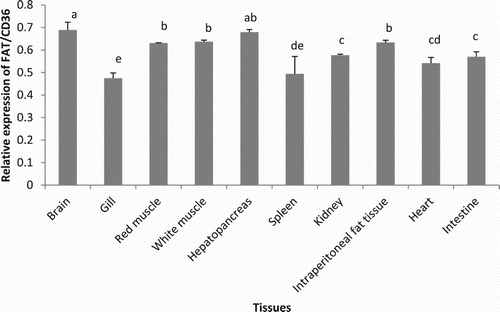
Figure 12. Expression of FAT/CD36 in different tissues of grass carp (C. idellus) by real-time quantitative PCR analysis. Values are mean ± SD (n = 3). Different letters denote statistically significant differences among tissues (P < .05).

Figure 12. Expression of FAT/CD36 in different tissues of grass carp (C. idellus) by real-time quantitative PCR analysis. Values are mean ± SD (n = 3). Different letters denote statistically significant differences among tissues (P < .05).

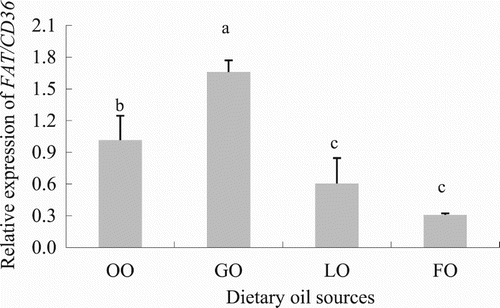
Figure 13. Effect of dietary oil sources on FAT/CD36 expression in grass carp (C. idellus). Values are expressed as means ± SD (n = 8). Different letters denote statistically significant differences among dietary groups (P < .05).

Figure 13. Effect of dietary oil sources on FAT/CD36 expression in grass carp (C. idellus). Values are expressed as means ± SD (n = 8). Different letters denote statistically significant differences among dietary groups (P < .05).