Figures & data
Table 1. Formulation of pellet diet and proximate composition of the pellet diet and clam meat used as food (g%).
Table 2. Tissue biochemical status, hepatosomatic index (HSI) and tail weight index (TWI) of different experimental groups.
Figure 1. Hepatopancreas protease and lipase activity in the different experimental groups. Values in the same column having different superscript are significantly different. Data expressed as Mean ± SE. One unit of protease expressed as units micromoles of tyrosine released/min. One unit of lipase expressed as micromoles of p-nitrophenol released/min.
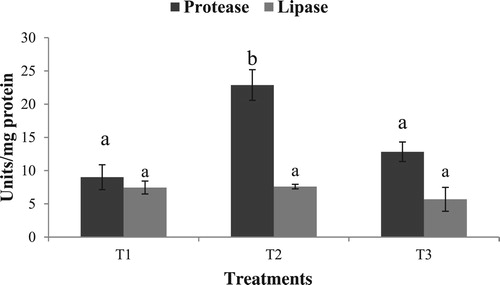
Figure 2. Hepatopancreas trypsin and chymotrypsin activity in the different experimental groups. Values in the same series having different superscript are significantly different. Data expressed as Mean ± SE. One unit of trypsin expressed as micromoles of p-nitroaniline released/min. One unit of chymotrypsin expressed as micromoles of benzoyl-tyrosine released/min.
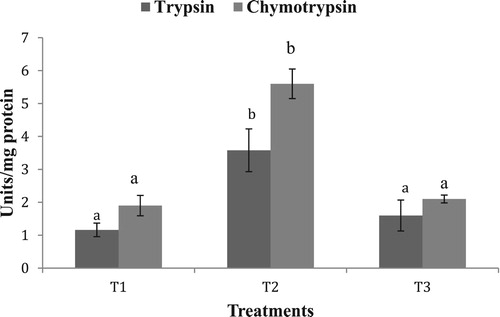
Figure 3. Hepatopancreas amylase activity in the different experimental groups. Value having different superscript is significantly different. Data expressed as Mean ± SE. One unit of amylase expressed as micromoles of maltose released/min.
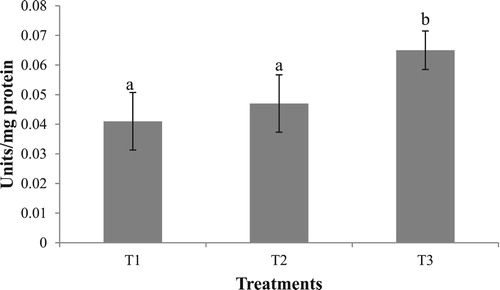
Figure 4. Hepatopancreas α Glucosidase and ß Glucosidase activity in the different experimental groups. Values having different superscript are significantly different. Data expressed as Mean ± SE. One unit of α Glucosidase expressed as micromoles of p-nitrophenol released/min. One unit of ß Glucosidase expressed as micromoles of p-nitrophenol released/min.
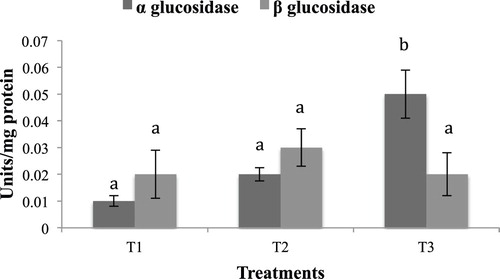
Figure 5. Hepatopancreas total free amino acid content (mg/g wet weight) in the different experimental groups. Values having different superscript are significantly different. Data expressed as Mean ± SE.
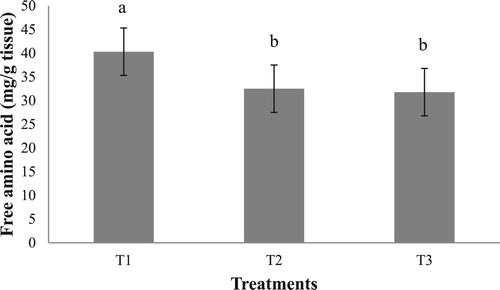
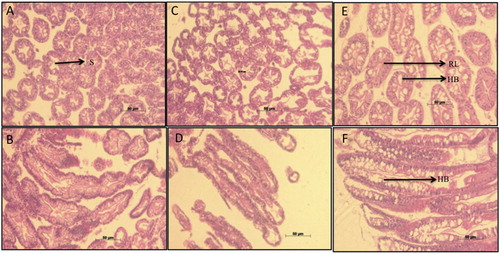
Figure 6. Histological micrographs of digestive gland tubules of P. homarus juveniles reared on different feeding regimes of fresh clam (transverse section-A, lateral section-B), starvation (transverse section-C, lateral section-D) and pelletized feed (transverse section E, lateral section F). Hypertrophy of B-cells (HB) in the group fed pellet feed (T3) can be observed both in pictures E and F. T3 also exhibits reduced lumen area (RL) due to thickening of the lumen wall and loses the typical ‘star shape’ (S), which is clearly observed in group fed with clam meat (A).