Figures & data
Figure 1. Map of study area (Chitwan National Park) in Nepal.
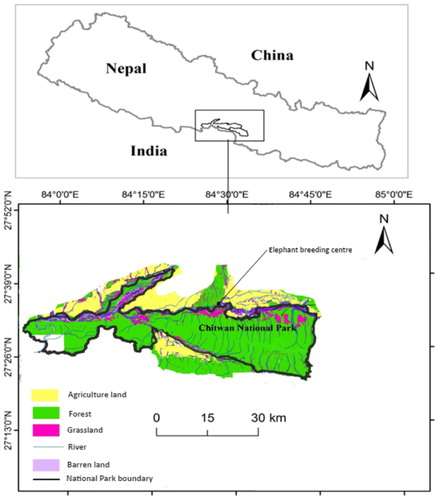
Table 1 . Name, age, sex, season surveyed and disease status of 16 domestic Asian elephants in the elephant breeding centre in Chitwan, Nepal.
Table 2. List of natural and provisioned foods (browse, grass and pellet) eaten by elephants in different seasons of the year.
Figure 2. Seasonal nutrient content percentages of top ten most important key food items.
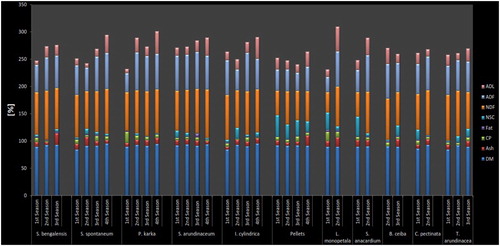
Table 3. Comparative digestibility of different nutrients in Asian elephants’ diets.
Figure 3. Right-angled mixture triangle (RMT) showing the seasonal balance of crude protein (CP), Neutral detergent fibre (NDF) and non-protein macronutrient energy (CF + NSC). Protein is shown on the implicit z-axis, with the dashed reference line indicating 12% crude protein.
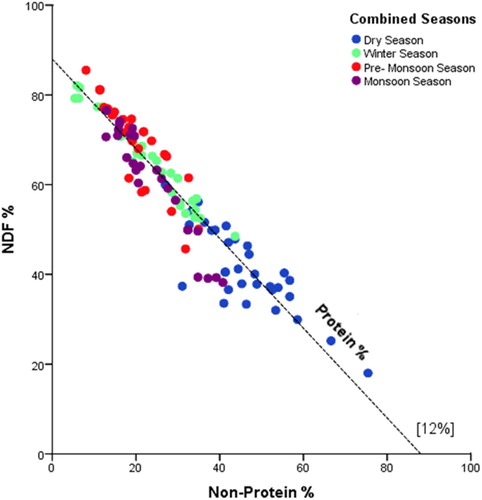
Figure 4. (A–D) Right-angled mixture triangle (RMT) showing the seasonal variation and intake balance of macronutrient and NDF in individual elephants.
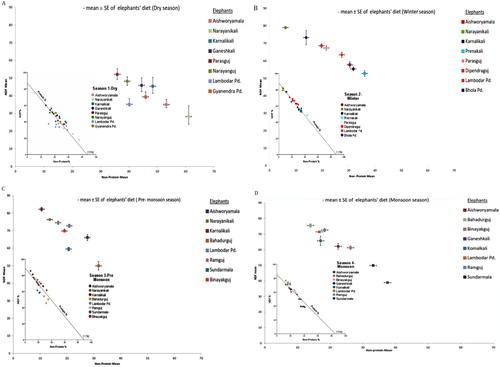
Figure 5. Nutrient balance of different reproductive status of female elephants.
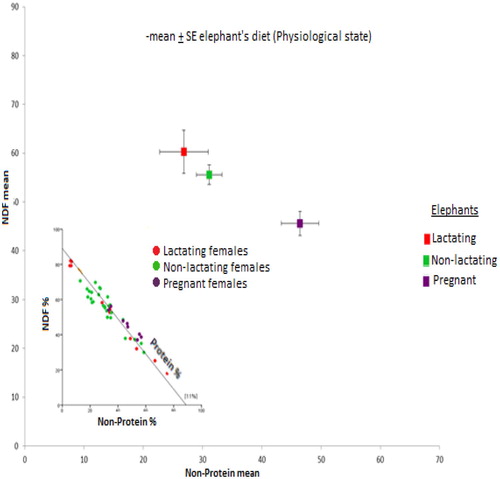
Figure 6. Right-angled mixture triangle (RMT) showing the comparative percentage of male and female daily energy intake from crude protein (CP), NDF and non-protein macronutrients (NSC + CF).
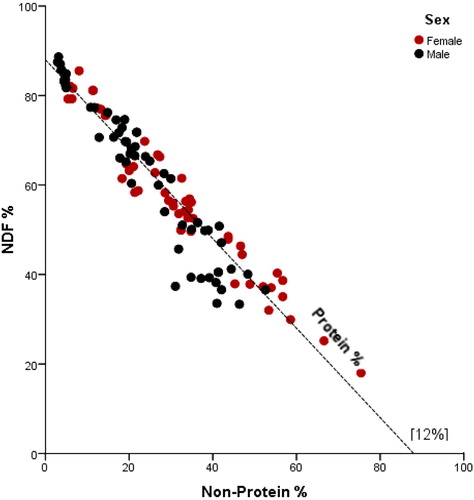
Figure 7. Right-angled mixture triangle (RMT) showing the comparative percentage of tuberculosis-positive and tuberculosis-negative individuals’ daily energy intake from crude protein (CP), NDF and non-protein macronutrients (NSC + CF).
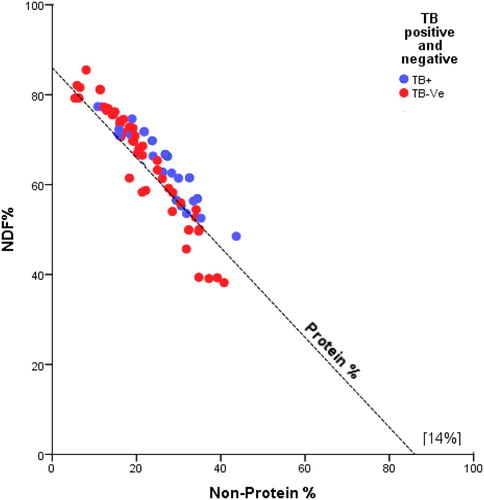
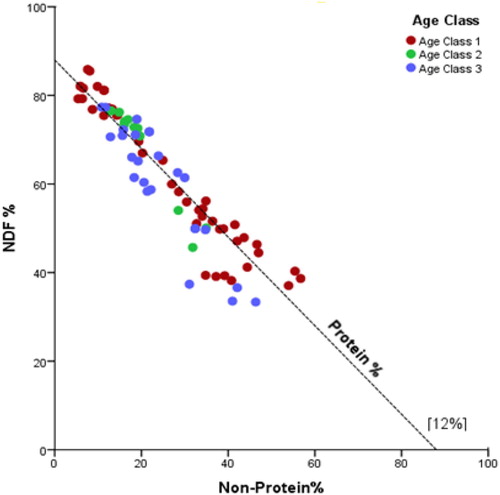
Figure 8. Right-angled mixture triangle (RMT) comparing across the different age groups the percentage of daily energy intake from crude protein (CP), NDF and non-protein macronutrients (NSC + CF).