Figures & data
Table 1. Mean ± SD of complete blood counts, total protein, fibrinogen, TP/F ratio, and blood differential cell counts (per cent and absolute) for 10 adult cattle at days 0, 1, 4, 5, and 6 post-BAL procedure.
Table 2. Mean ± SD of BAL fluids differential cell counts, total cell counts (manual and automated), and total protein for 8 apparently healthy adult cattle.
Table 3. The microbiological finding of BAL fluids for 8 apparently healthy adult cattle.
Figure 1. Alveolar macrophages contain intracytoplasmic pollen grain (arrow) and cellular debris (two arrows) in TW from apparently healthy cattle (Diff-Quick stain, oil immersion).
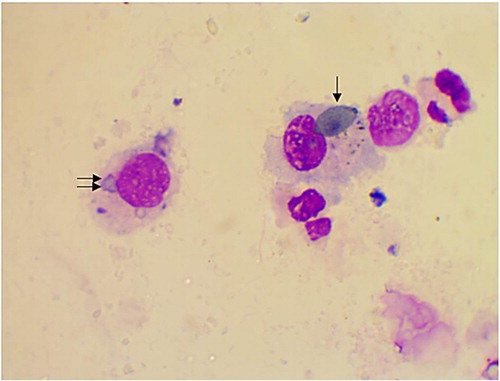
Figure 2. Binucleated alveolar macrophage in BAL from apparently healthy cattle, arrow (Diff-Quick stain, oil immersion).
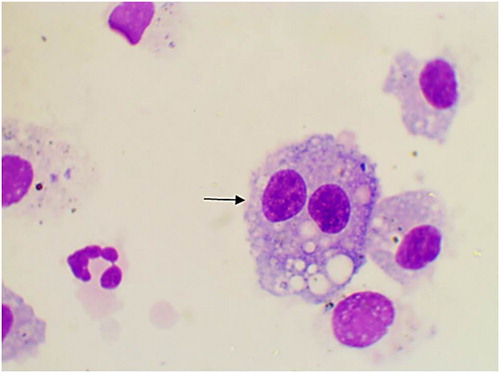
Figure 3: Trinucleated alveolar macrophage (arrow) in BAL from apparently healthy cattle, arrow (Diff-Quick stain, oil immersion).
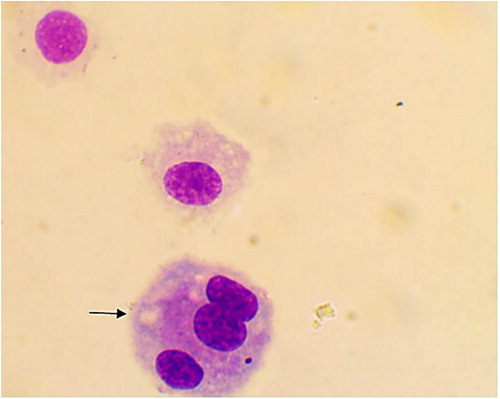
Figure 4. Multinucleated alveolar macrophage in BAL from apparently healthy cattle, arrow (Diff-Quick stain, oil immersion).
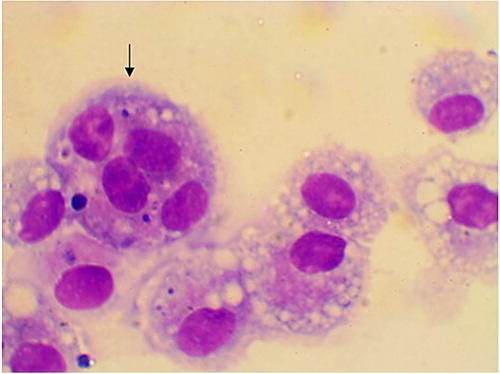
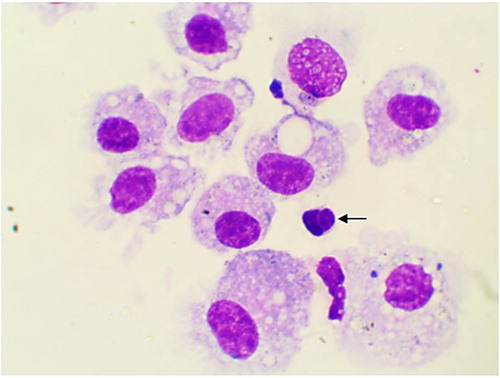
Figure 5. Normally segmented non-degenerative neutrophils (arrows) in BAL from apparently healthy cattle, arrow (Diff-Quick stain, oil immersion).
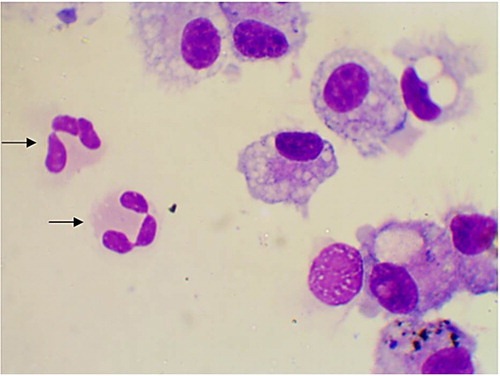
Figure 6. Lymphocyte (arrow) in BAL from apparently healthy cattle (Diff-Quick stain, oil immersion).