Figures & data
Table 1. Quantities of food (kg/cow/day) distributed to control and experimental groups before and after calving.
Table 2. Ingredients, chemical composition and nutrient values of concentrate of control and experimental diets used in this study.
Table 3. Chemical composition and nutrient values of forages used in cow diet.
Table 4. Milk and blood parameters from cows on each treatment.
Figure 1. Mean milk yield in Zeolite-treated cows (EG) and untreated control cows (CG).
Note: NS, nonsignificant; **P < .01.
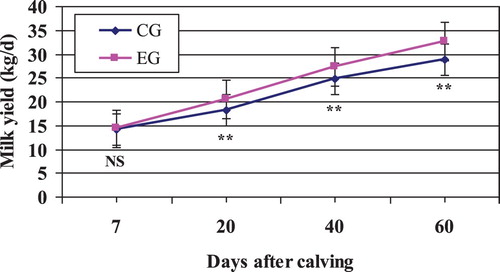
Figure 2. Mean milk fat content in Zeolite-treated cows (EG) and untreated control cows (CG).
Note: NS, nonsignificant.
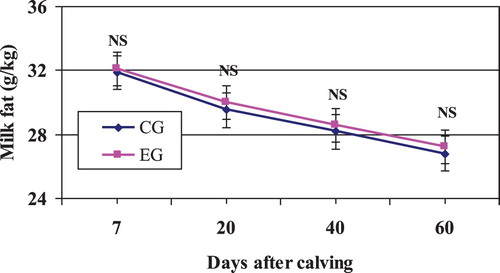
Figure 3. Mean milk protein content in Zeolite-treated cows (EG) and untreated control cows (CG).
Note: NS, nonsignificant.
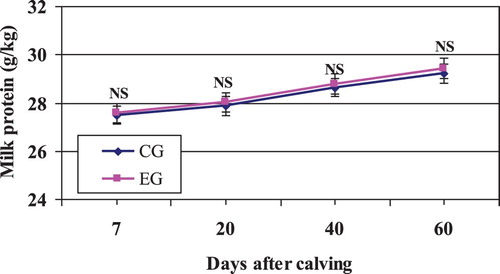
Figure 4. Mean milk Ca content in Zeolite-treated cows (EG) and untreated control cows (CG).
Note: NS, nonsignificant.
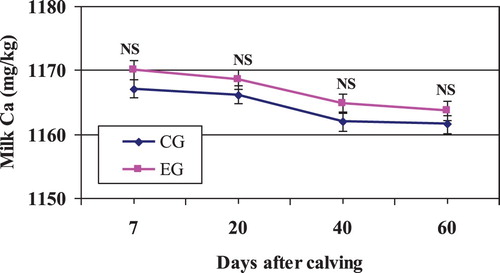
Figure 5. Mean milk P content in Zeolite-treated cows (EG) and untreated control cows (CG).
Note: NS, nonsignificant.
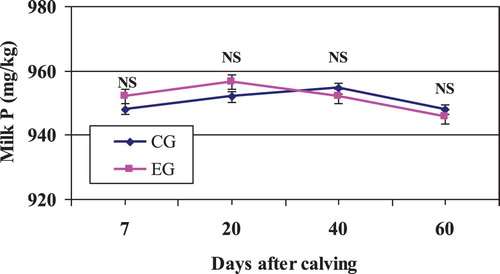
Figure 6. Mean milk Mg content in Zeolite-treated cows (EG) and untreated control cows (CG).
NS, nonsignificant.
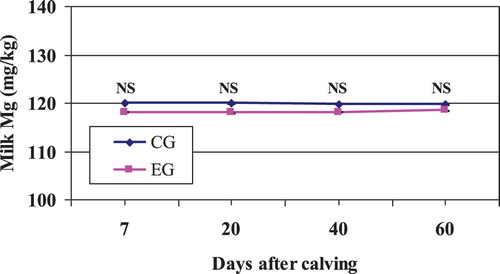
Figure 7. Mean plasma Ca in Zeolite-treated cows (EG) and untreated control cows (CG).
Notes: The solid horizontal lines indicate the upper and lower limit of the reference interval. NS, nonsignificant; **P < .01; ***P < .001.
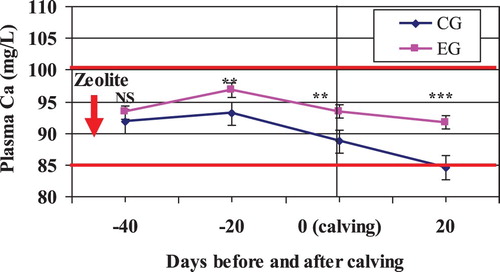
Figure 8. Mean plasma P in Zeolite treated cows (EG) and untreated control cows (CG).
Notes: The solid horizontal lines indicate the upper and lower limit of the reference interval. NS, nonsignificant.
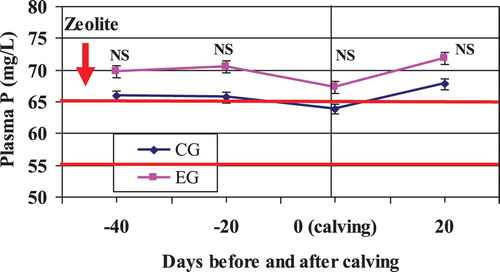
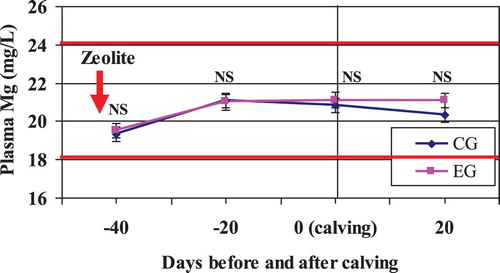
Figure 9. Mean plasma Mg in Zeolite-treated cows (EG) and untreated control cows (CG).
Notes: The solid horizontal lines indicate the upper and lower limit of the reference interval. NS, nonsignificant.