Figures & data
Table 1. Number of cows, herds and test day milk yield records as well as 305-day milk yield records (TMY) of genetic groups with different proportion of Holstein genes obtained from the Brazilian databases.
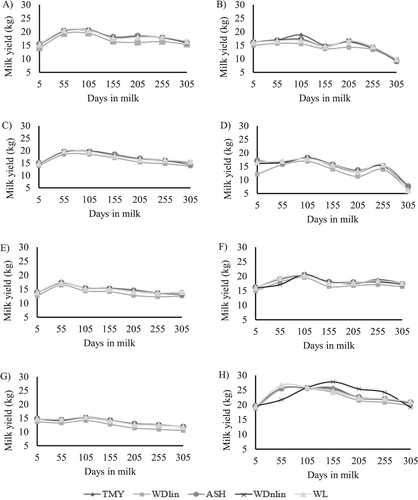
Figure 1. Trajectory of lactation curves estimated by 305-day milk yield from database (TMY), Wood’s linear model (WDlin), Ali and Schaeffer’s model (ASH), Wood’s nonlinear model (WDnlin) and Wilmink model (WL) for 1/2H (A), 1/4H (B), 3/4H (C), 3/8H (D), 5/8H (E), 7/8H (F), G (G) and H (H) genetic groups.