Figures & data
Figure 1. Candidate CpG regions and their average DNA methylation levels of imprinted gene h19, igf2, igf2r, dlk1 and gtl2. (a) Schematic diagram of candidate CpG regions in the imprinted gene h19, igf2, igf2r, dlk1 and gtl2. (b) The average DNA methylation levels of different candidate CpG regions of imprinted gene h19, igf2, igf2r, dlk1 and gtl2 in lung, muscle, heart, kidney and liver of TSF, TSM, CSF and CSM. R indicates candidate CpG region.
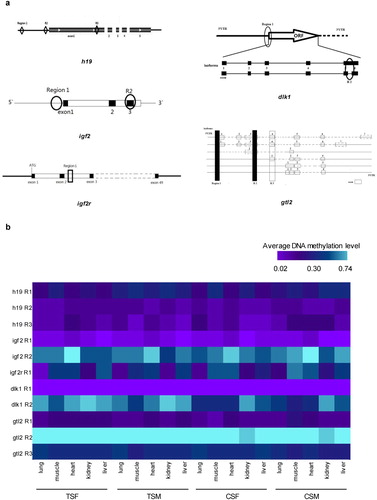
Figure 2. Differential methylation status. (a) Number of differentially methylated CpG sites and (b) whether or not differential methylation occurred in candidate CpG regions of imprinted gene h19, igf2, igf2r, dlk1 and gtl2 in heart, lung, muscle, kidney and liver by comparing TSF with CSF, TSM with CSM, and TSM with TSF. (c) Gender-neutral methylation. R indicates candidate region of CpG. DM and horizontal line denote differential methylation and no differential methylation, respectively.
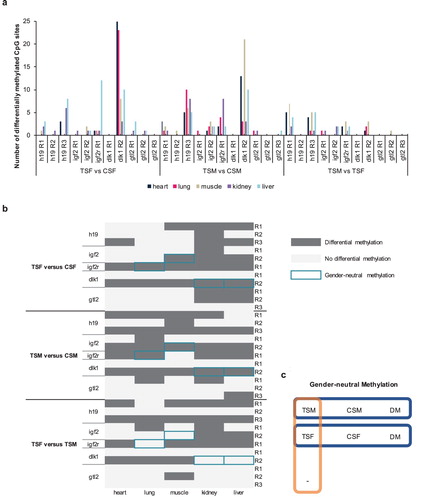
Figure 3. Number of differentially methylated CpG sites of imprinted gene (a) h19, (b) igf2, (c) igf2r and (d) dlk1 in heart, lung, muscle, kidney and liver by comparing TSF with CSF, TSM with CSM. TSF vs. CSF means the comparation of TSF and CSF. TSM vs. CSM means the comparation of TSM and CSM.
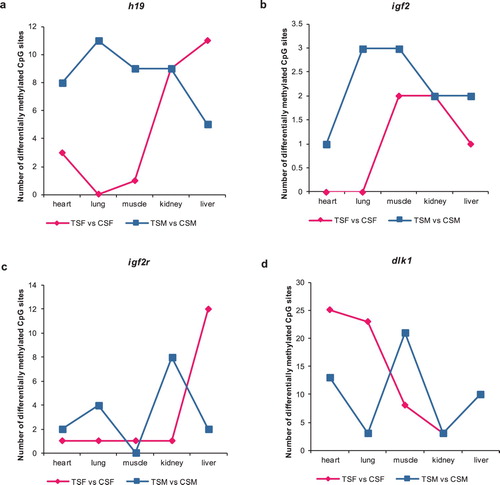
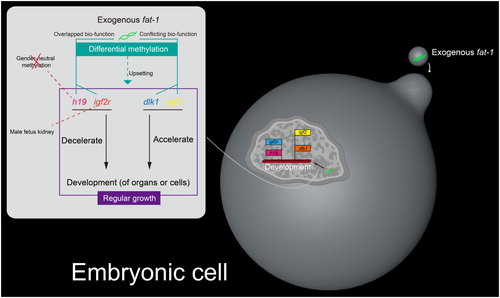
Figure 4. Effect mechanism of exogenous fat-1 via differential DNA methylation of imprinted genes in fat-1 transgenic foetus of sheep. Solid lines indicate previous research results. Dotted lines indicate new findings in our work.