Figures & data
Figure 1. Means (column) and 95% confidence intervals (lines) for melatonin concentration (pg/mL) in night milk and the total milk of individual cows in the low and high production groups during winter and summer.
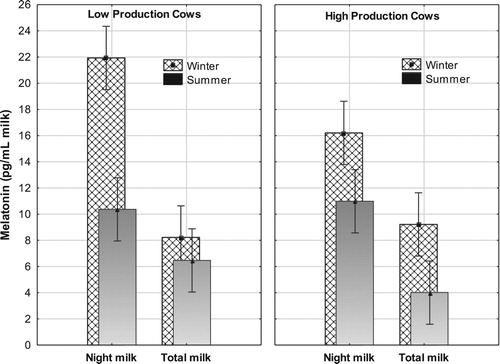
Table 1. Means of nutrient and urea compositions, and the somatic cells count (SCC) in the total daily milk from cows in the low (Low) and high (High) production groups during winter and summer.
Figure 2. Means (column) and 95% confidence intervals (lines) for illuminance levels (lux) inside the free-stall for the transition between day and night during winter and summer.
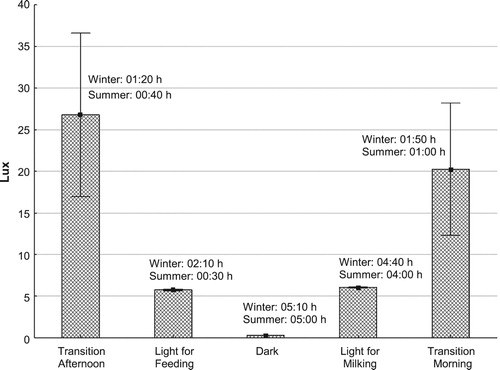
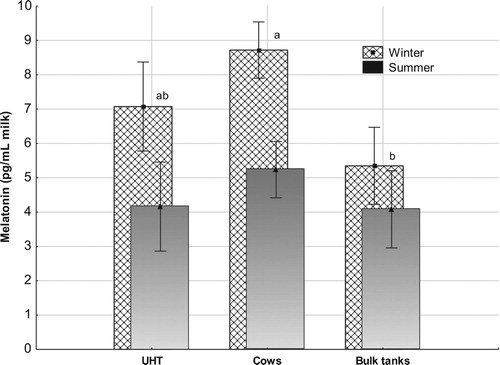
Figure 3. Means (column) and 95% confidence intervals (lines) for melatonin concentration (pg/mL) in the UHT processed milk from 12 different brands (n = 12/season), daily total milk from individual cows (n = 30/season), and bulk tank milk from 16 farms (n = 16/season) during winter and summer.