Figures & data
Figure 1. Viability of Vero cells exposed to different concentrations of aflatoxin B1 (0–30 µg/mL) for 48 h determined by NRU assays. The results are presented as percentage (mean ± SD) of three independent experiments.
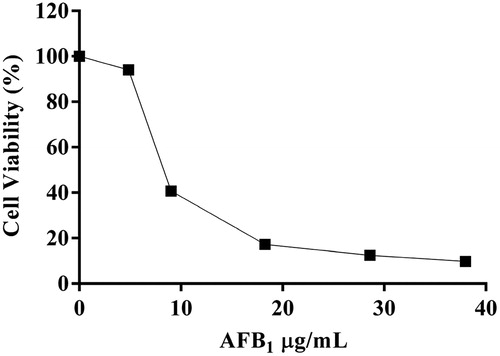
Figure 2. Viability of Vero cells exposed to aflatoxin B1 (10 µg/mL) and different concentrations of M. verticillata essential oil (0–500 µg/mL) for 48 h determined by NRU assays. The results are presented as percentage (mean ± SD) of three independent experiments. *P < .05 and **P < .01 indicates a significant difference compared with the control group (One-way ANOVA test).
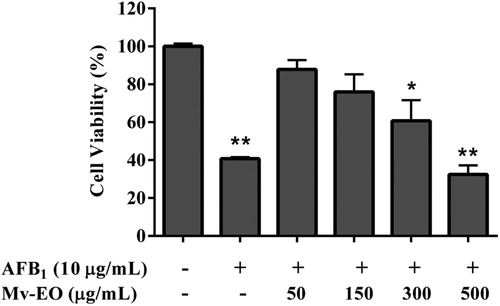
Table 1. Micronucleated erythrocytes in the bone marrow cells of male Wistar rat fed aflatoxin B1-contaminated diet (100 mg/kg) and treated with M. verticillata essential oil (0.04%).
Figure 3. Histological examination of internal organs of male Wistar rats fed aflatoxin B1-contaminated diet (100 mg/kg) and treated with M. verticillata essential oil (0.04%) for 45 d. Representative sections of liver, kidney (×400) and intestine (×200).
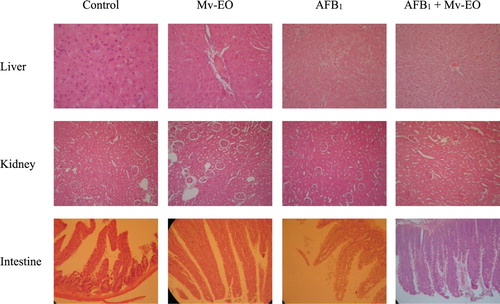
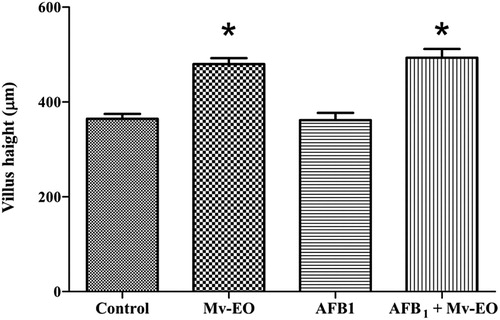
Figure 4. Effects of administration aflatoxin B1-contaminated diet (100 mg/kg) and M. verticillata essential oil (0.04%) on intestinal villus height of male Wistar rats through 45 d. All data are mean ± SEM of 5 rats/group. *P < .05 (Dunnett’s Multiple Comparison Test).