Figures & data
Figure 1. Typical 1H NMR spectra of muscle extracts of S. paramamosain collected from Cixi (CX), Sanmen (SM), Xiapu (XP), and Qinzhou (QZ). The dotted regions were vertically expanded by a factor 64 relative to the δ 4.7–0.9 regions. Lac: lactate; Ala: alanine; Glu: glutamate; Gln: glutamine; Bet: betaine; Arg: arginine; TMAO: trimethylamine-N-oxide; Tau: taurine; Gly: glycine; α-Glc: α-Glucose; Fum: fumarate; HQ: hydroquinone; Tyr: tyrosine; Phe: phenylalanine; His: histidine; Ino: inosine; IMP: inosine 5’-monophosphate; AMP: adenosine 5’-monophosphate; PM: 2-pyridinemethanol; Tri: trigonelline; MeOH: methanol; U1: unidentified signal 1.
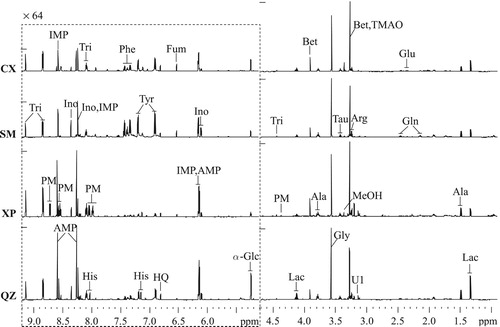
Table 1. 1H and 13C NMR data and assignments of the metabolites in muscle extracts of S. paramamosain.
Figure 2. PCA scores plot of the muscle extracts of S. paramamosain collected from Cixi (black stars), Sanmen (blue diamonds), Xiapu (orange triangles), and Qinzhou (purple circles).
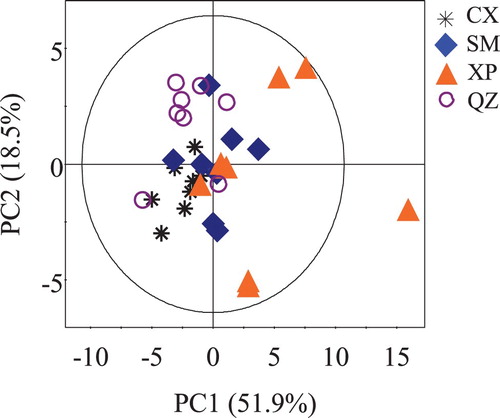
Figure 3. OPLS-DA scores (left) and coefficient-coded loadings plots (right) for the models discriminating extracts of Cixi crabs (CX, black stars) from the extracts of crabs from Sanmen (SM, blue diamonds, A), Xiapu (XP, orange triangles, B), and Qinzhou (QZ, purple circles, C). Gln: glutamine; Fum: fumarate; TMAO: trimethylamine-N-oxide; AMP: adenosine 5’-monophosphate; 2-PM: 2-pyridinemethanol; U1: unidentified signal 1.
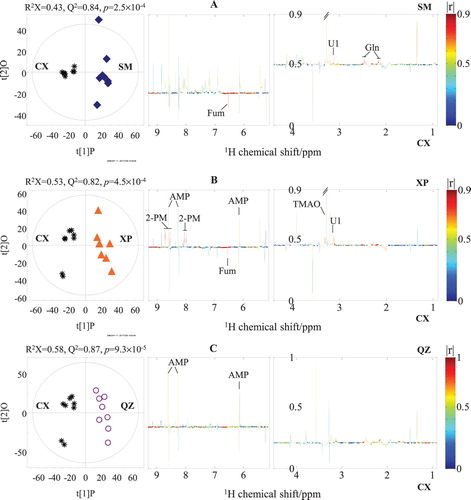
Figure 4. OPLS-DA scores (left) and coefficient-coded loadings plots (right) for the models discriminating the extracts of Sanmen crabs (SM, black stars, A), Xiapu crabs (XP, orange triangles, B), and Qinzhou crabs (QZ, purple circles, C). Ala: alanine; Glu: glutamate; Gln: glutamine; Tyr: tyrosine; Phe: phenylalanine; IMP: inosine 5’-monophosphate; 2-PM: 2-pyridinemethanol; U1: unidentified signal 1.
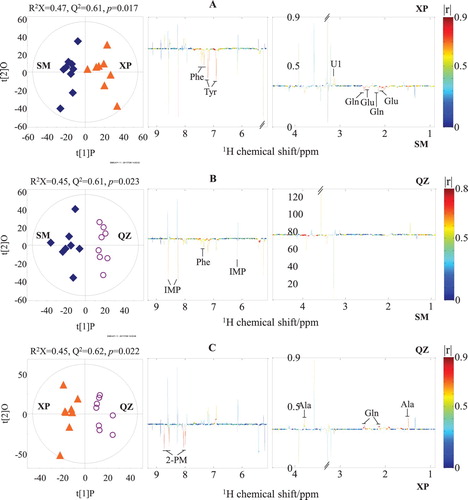
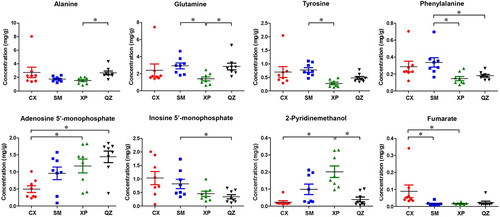
Figure 5. Content of selected significantly changed metabolites identified from the muscle extracts of S. paramamosain collected from Cixi (CX), Sanmen (SM), Xiapu (XP), and Qinzhou (QZ). Data are given as the average concentration (mg/g crab muscle) and standard deviation obtained from eight parallel samples. Significant differences were obtained by one-way ANOVA. *p < 0.05.