Figures & data
Table 1. Sequences of primers used in the study.
Figure 1. cDNA and deduced amino acid sequence of PfBMP3. Normal and bold numbers on the left indicate the positions of the cDNA and deduced amino acid sequences, respectively. Bold letters in cDNA sequence are initiation and termination codons, respectively. Putative signal peptide is in red. TGF-b propeptide is in italics. TGF-b like domain is underlined.
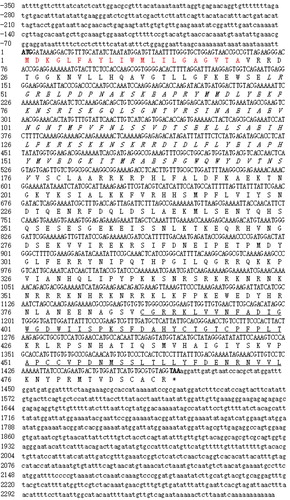
Figure 2. Multiple alignments of mature BMP3 from different species. Numbers on the right indicate the positions of the amino acids of each protein. Numbers in the lower part of the alignment sequences indicate the seven shared cysteine residues among the different species. Conservative amino acids of the seven species are in white on grey background.
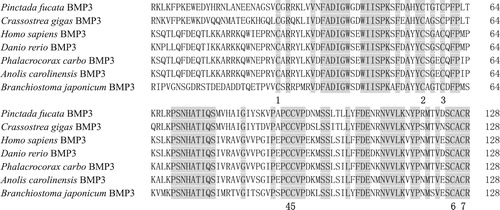
Figure 3. Phylogenetic tree based on BMP3 homologous proteins of different species.
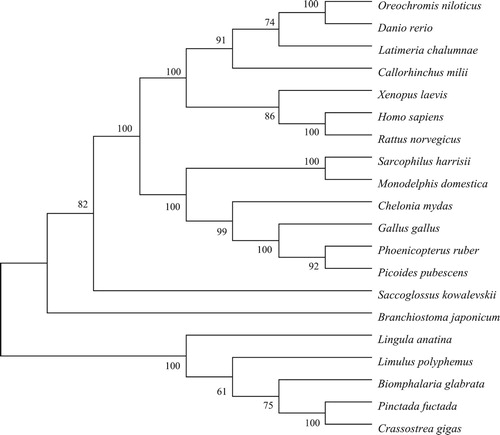
Figure 4. Relative expression levels of PfBMP3 at different developmental stages of P. fucata. T, D, U, E, and M are trochophore, D-veliger, umbo-veliger, eyespot, and metamorphic stages, respectively. Significant difference is indicated by different letters (n = 3, P < 0.05). Error bars correspond to means + SE.
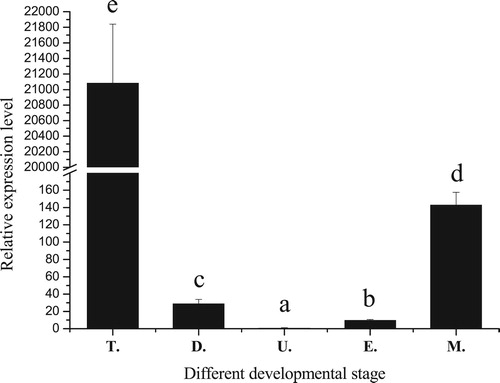
Figure 5. Relative expression levels of PfBMP3 in different tissues of P. fucata. H, A, He, G, I, P, M, and Gi are hepatopancreas, adductor muscle, hemocyte, gonad, intestine, pearl sac, mantle, and gill, respectively. Significant difference is indicated by different letters (n = 3, P < 0.05). Error bars correspond to means + SE.
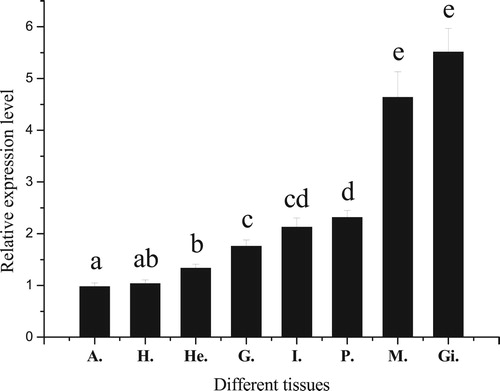
Figure 6. In situ hybridization of PfBMP3 in the mantle. Frames a and c are negative control. Frame b is positive result. Frames d, e, and f are higher magnifications of b. Brown hybridization signal is indicated by arrow. IF, MF, OF, OE, and IE are inner fold, middle fold, open fold, open epithelium, and inner epithelium, respectively.
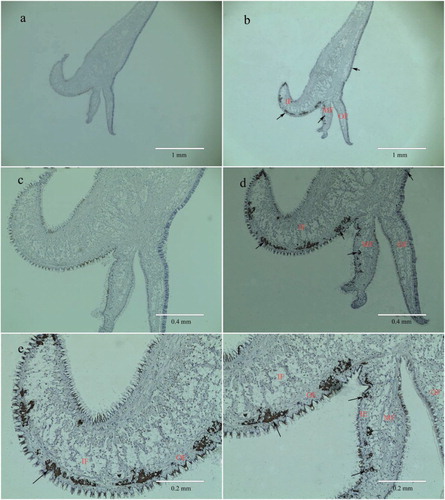
Figure 7. Pinctada fucata after notching. Frames a and b are P. fucata at 0 and 48 h after treatment, respectively.
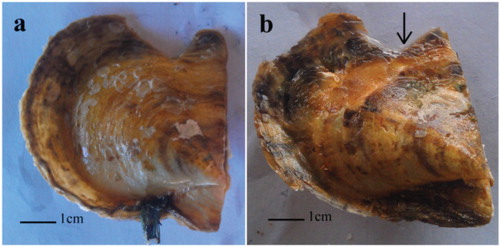
Figure 8. Relative expression levels of PfBMP3 at different times after shell notching. A and B are analysis results of the gill and mantle. Different lower-case letters indicate a significant difference in gene expression levels between different treatment groups (n = 3, P < 0.05). * indicates significantly different compared with control (n = 3, P < 0.05). Error bars correspond to means + SE.
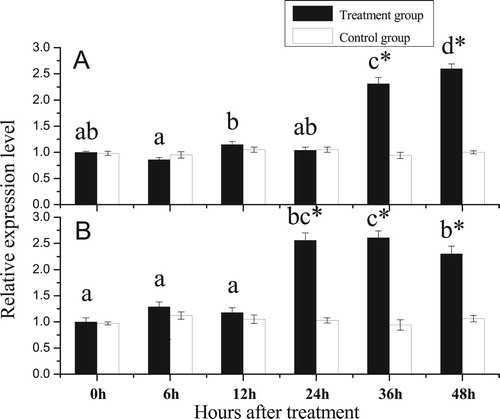
Figure 9. Relative expression levels of PfBMP3 and PfCaM in the gill under different calcium ion concentrations. Different lower-case letters indicate significant differences in PfBMP3 gene expression levels between different treatment groups (n = 3, P < 0.05). Different upper-case letters indicate significant differences in PfCaM gene expression levels between different treatment groups (n = 3, P < 0.05). Error bars correspond to means + SE.
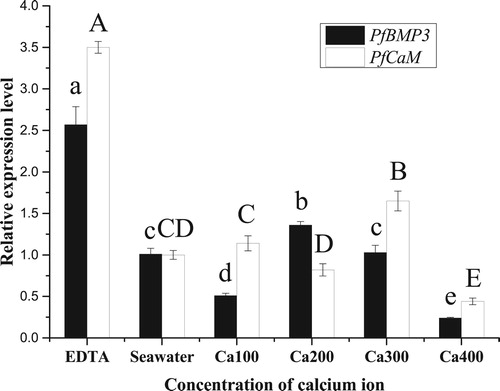
Figure 10. Relative expression levels of PfBMP3 and PfCaM in the mantle under different calcium ion concentrations. Different lower-case letters indicate significant differences in PfBMP3 gene expression levels between different treatment groups (n = 3, P < 0.05). Different upper-case letters indicate significant differences in PfCaM gene expression levels between different treatment groups (n = 3, P < 0.05). Error bars correspond to means + SE.
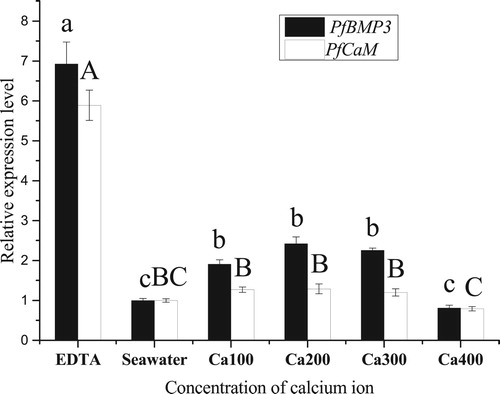
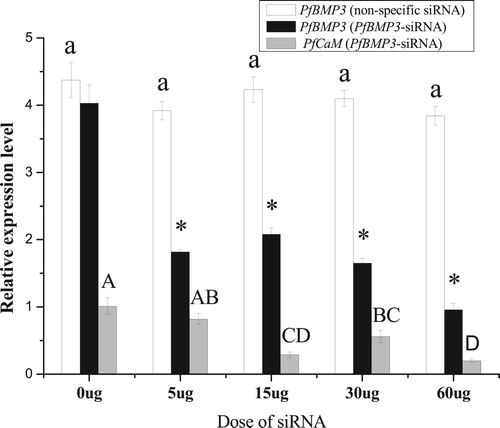
Figure 11. Relative expression levels of PfBMP3 and PfCaM in the gill after RNAi. Colourless columns are relative expression levels of PfBMP3 in the control groups treated with non-specific siRNA. Black columns are relative expression levels of PfBMP3 in groups treated with PfBMP3-siRNA, * indicates significant differences compared with control (n = 3, P < 0.05). Grey columns are relative expression levels of PfCaM. Different upper-case letters indicate significant differences in PfCaM gene expression levels between different treatment groups (n = 3, P < 0.05). Error bars correspond to means + SE.