Figures & data
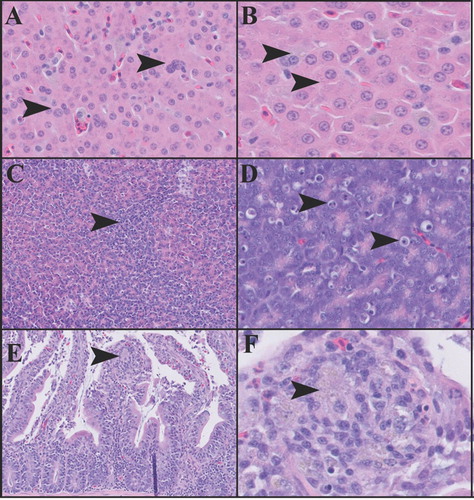
Figure 1. Survivorship (%) of birds from the range-finding and definitive tests from 1 to 10 days post-dosing.
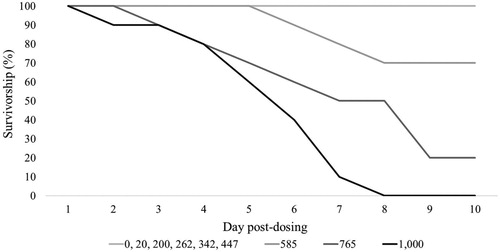
Figure 2. The day birds from the range-finding and definitive tests died. The 585 (n = 3, 2 male and 1 female) and 765 (n = 8, 4 male and 4 female) mg/kg BW doses are from the definitive test, and the 1,000 (n = 9, 5 male and 4 female) mg/kg BW dose is from the range-finding test.
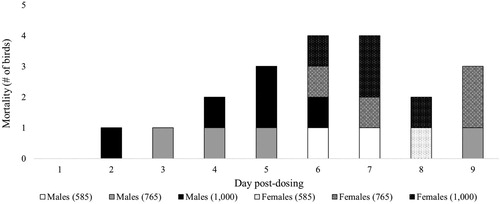
Figure 3. The log10 dose–response curve of gossypol. The probability of mortality (%) is plotted against the log10[Gossypol] (mg/kg BW) curve. The estimated dose–response curve is bound by the lower 95% CI (dark grey) and upper 95% CI (light grey).
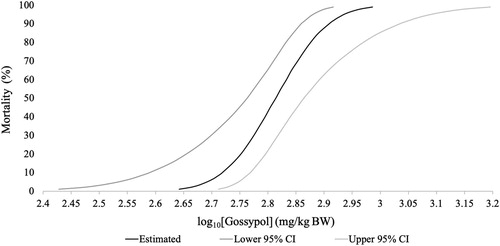
Figure 4. Tissue sections of the liver (A and B), pancreas (C and D), and duodenum (E and F) from birds dosed with 1,000 mg/kg BW of gossypol. Liver (A), 200× magnification. Hepatocytes and Kupffer cells contain pigment, and there is marked variability in the size and number of hepatocytes nuclei (arrowheads). Liver (B), 400× magnification. Arrowheads indicate pigment accumulation in hepatocytes. Pancreas (C), 100× magnification. Arrowhead indicates the zonal region in which there is a collapse of exocrine acini, and remaining exocrine acinar cells exhibit increased cytoplasmic basophilia. Pancreas (D), 200× magnification. Arrowheads indicate individual exocrine acinar cell necrosis (apoptosis). Duodenum (E), 200× magnification. Arrowhead indicates cluster of pigment-laden macrophages within a blunted villus tip. Duodenum (F), 400× magnification. Arrowhead indicates cluster of pigment-laden macrophages. A small number of heterophils are present at the base of the arrowhead.