Figures & data
Figure 1. Growth of fish recorded at the end of experimental period. (a) Scatter plot shows that weight of fish in probiotic treated groups t1 and t2 is significantly high as compared to the control group (con). (b) Scatter plot shows that the length of fish in probiotic treated groups is higher as compared to the control group. Asterisks indicate significant differences (* p < .05; ** p < .01) tested by one-way ANOVA with Tukey’s method as post-hoc test.
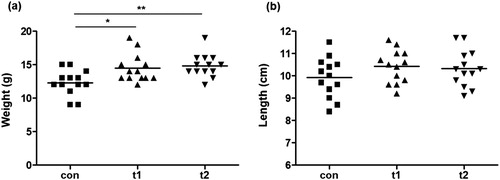
Table 1. Growth parameters of Labeo rohita: Con (control), t1 (Ecotec supplementation 8 × 10⁷ CFU/g feed), t2 (Ecotec supplementation 16 × 107 CFU/g feed). Values with a different superscript in the same row are significantly different.
Figure 2. Quantification of Thyroid hormones. Quantity of thyroid hormones in the serum was measured at the end of expermental period. (a) Amount of Triiodothyronine (T3) in control (con) was significantly high as compared to probiotic treated groups (t1 and t2). (b) Amount of Thyroxine (T4) in con was significantly high as compared to t1 and t2. (c) Thyroid stimulating hormone (TSH) was significantly low in con as as compared to t1 and t2. Data are the mean ± SEM of three replicates. Asterisks indicate significant differences (* p < .05; ** p < .01) tested by one-way ANOVA analysis with Tukey’s method as post-hoc test.
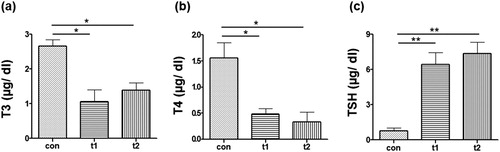
Figure 3. Total Leukocyte Count (TLC), Total Erythrocyte Count (TEC) and Haemoglobin (Hb). (a) TLC was done after eight weeks of probiotic treatment. Total number of leukocytes in control (con) are significantly high as compared to probiotic treated groups t1 and t2. (b) The number of erythrocytes showed no significant difference between control and treated groups. (c) Hb was not significantly different between con and probiotic treated groups. Data are the mean ± SEM of three replicates. Asterisks indicate significant differences (* p < .05; ** p < .01) tested by one-way ANOVA analysis with Tukey’s method as post-hoc test.
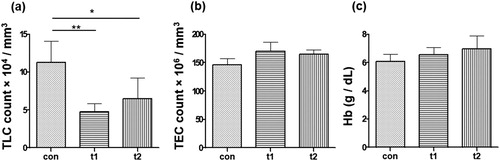
Figure 4. Differential leukocyte count (DLC). Lymphocytes and monocytes were higher in no. in the control group (con) as compared to the probiotic treated groups (t1 and t2). However, the neutrophils and basophils were abundant in probiotic treated groups as compared to the control group. Data are the mean ± SEM of two independent replicates.
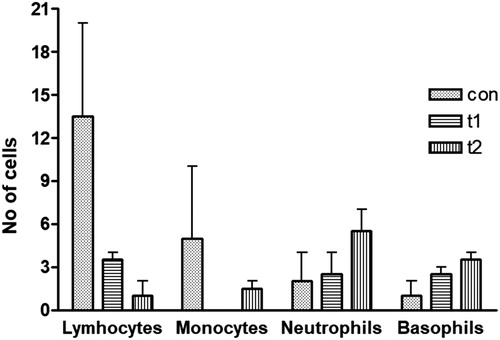
Figure 5. Biochemical parameters. (a) Total Protein (TP) level was high in probiotic supplemented groups (t1 and t2) as as compared to control (con). (b) Albumin (ALB) level was not much different between con and probiotic treated groups. (c) Globulin (GLB) was significantly high in t2. (d) A/G ratio of probiotic treated groups was low than the con group. Data are the mean ± SEM of three replicates. Asterisks indicate significant differences (* p < .05) tested by one-way ANOVA analysis with Tukey’s method as post-hoc test.
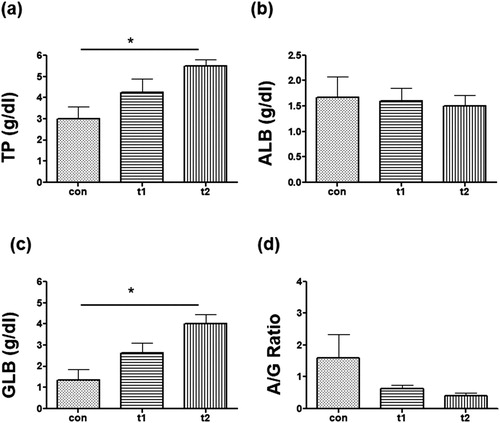
Figure 6. Immunological parameters. (a) Lysozyme (Lys) activity was significantly high in probiotic supplemented groups (t1 and t2) as as compared to control (con). (b) Myeloperoxidase (MPO) activity was significantly different between con, t1 and t2. (c) Super oxide dismutase (SOD) level waas high in ti and t2 and was significantly high in t2 than con. (d) Catalase (CAT) activity was significantly high in t1 and t2 groups than the con group. Data are the mean ± SEM of three replicates. Asterisks indicate significant differences (* p < .05; ** p < .01) tested by one-way ANOVA analysis with Tukey’s method as post-hoc test.
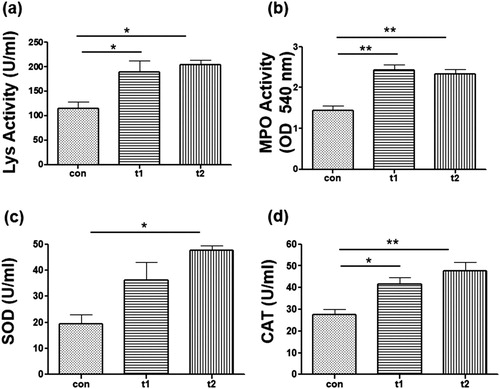
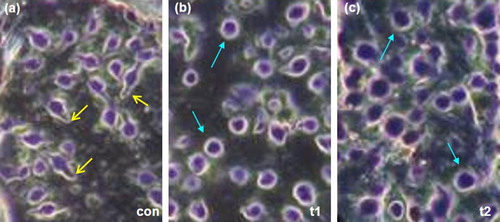
Figure 7. Representative images of morphology of the monocytes after probiotic treatment. (a) Morphology of the monocytes in the control group. (b) Morphology of the monocytes in the t1 group. (c) Morphology of the monocytes in the t2 group. The control group showed more elongated macrophages bearing processes (highligted by yellow arrows), Monocytes in the probiotic treated groups (t1, t2) showed a round morphology (highlighted by green arrows).