Figures & data
Table 1. Primers used in this study.
Figure 1. Nucleotides and the deduced amino acids sequences of RcCCR9. The start codon (ATG) and the stop codon (TAG) are marked in red. The polyadenlylation signal (AATAAA) is indicated in blue and the poly A is underlined with a horizontal line. The translation transmembrane domains are indicated in blue, and the conserved DRY motif is underlined with a red dotted line.
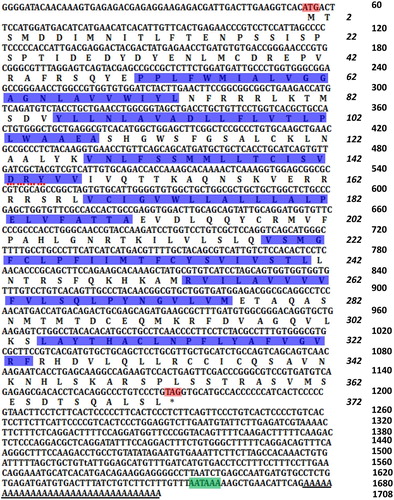
Figure 2. Diagrammatic representation of the domain structure and the topology of transmembrane regions in RcCCR9. The N-terminal, seven-transmembrane domains (TM1-7), three extracellular loops (ECL1-3), three intracellular loops (ICL1-3) and C-terminal are shown. The DRY motif in the TM-3 region is also indicated. Putative cysteine residues (C) involved in disulfide bonding are shown with a black dotted line. Potential N-glycosylation sites are marked in red shaded boxes.
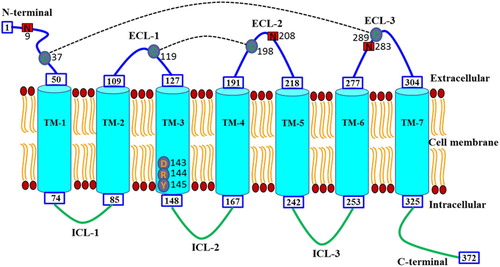
Figure 3. Multiple alignment of the deduced amino acid sequences of CCR9. The multiple alignment was produced using ClustalW, and conserved amino acids shaded using BOXSHADE (version 3.21). The N-terminal, seven transmembrane domains (TM1-7), three extracellular loops (ECL1-3) and intracellular loops (ICL1-3) and the C-terminal are marked above the alignment. The four conserved cysteine residues in the extracellular domain are indicated by black arrows. The DRY motif is indicated by asterisk below the alignment. The potential N-glycosylation sites and conserved tyrosine residues in the N-terminal domain are shown with the red dotted lines and red lines, respectively. R.c (Rachycentron canadum), L.c (Larimichthys crocea), O.n (Oreochromis niloticus), P.o (Paralichthys olivaceus), S.s (Salmo salar), S.m (Scophthalmus maximus), M.m (Mus musculus) and H.s (Homo sapiens), the GenBank accession numbers are listed in .
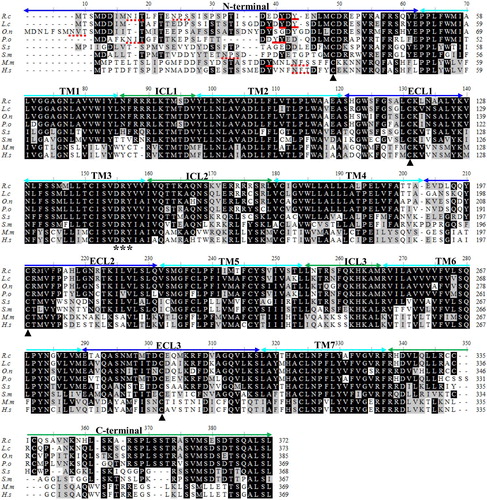
Figure 4. Phylogenetic analysis of partial vertebrate CCR9 and other chemokine receptors. A neighbor-joining tree was constructed using Mega 5.1 software. Numbers on the lines indicate the percentages of bootstrap values after 1000 replicates. RcCCR9 and atypical chemokine receptors are marked with black dot and triangles, respectively. The GenBank accession numbers are listed in Table S1.
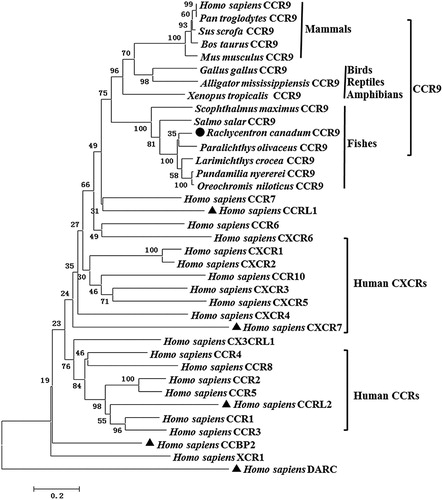
Table 2. Amino acid identity of RcCCR9 with partial vertebrate CCR9.
Figure 5. Constitutive expression of cobia RcCCR9 in twelve tissues from three healthy fish was determined by quantitative real-time RT-PCR. The mRNA expression levels were normalized to the endogenous control gene, β-actin. Data were expressed as a ratio to RcCCR9 mRNA expression in the brain. Each vertical bar represented the mean ± SE (N = 3). Significant differences in RcCCR9 expression between the brain and other tissues are indicated with an asterisk (*) for P < 0.05 or with two asterisks (**) for P < 0.01.
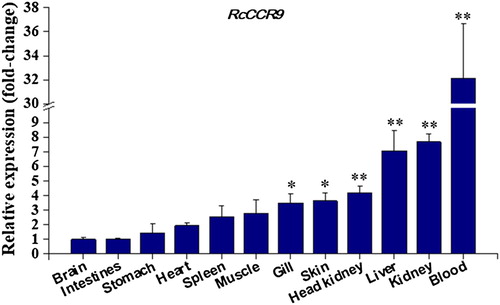
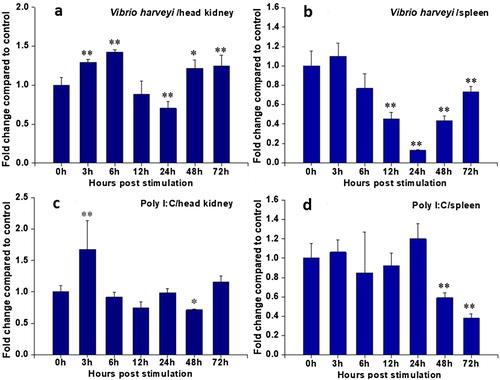
Figure 6. Expression analysis of RcCCR9 in head kidney and spleen at different time points after stimulation by quantitative real-time RT-PCR. The mRNA expression levels were normalized to the endogenous control gene, β-actin. The RcCCR9 expression in head kidney (a) and spleen (b) after treatment with inactivated V. harveyi, respectively; the RcCCR9 expression in head kidney (c) and spleen (d) after treatment with poly I:C, respectively. Data were expressed as a ratio to RcCCR9 mRNA expression in the respective PBS control. Each vertical bar represented the mean ± SE (N = 3). Significant differences in RcCCR9 expression between stimulated and unstimulated tissues (0 h) were indicated with an asterisk (*) for P < 0.05 or with two asterisks (**) for P < 0.01.