Figures & data
Table 1. Number of sires and daughters by class of daughters per sire.
Table 2. Number of observations, arithmetic means, standard deviations (in parenthesis) for milk yield, SCS, and DIM by test number.
Figure 1. Average daily milk yield (solid line) and somatic cell score (dashed line).
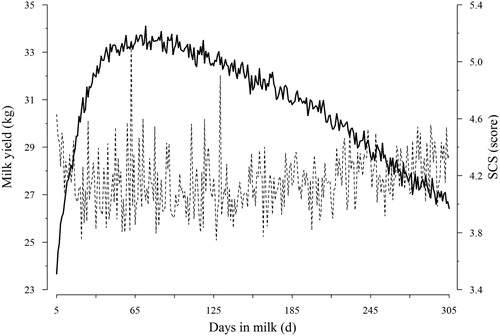
Figure 2. Daily genetic (AG) and permanent environmental (PE) variances for TD milk yield (solid line) and SCS (dashed line) over the lactation (variances for SCS are multiplied by 20).
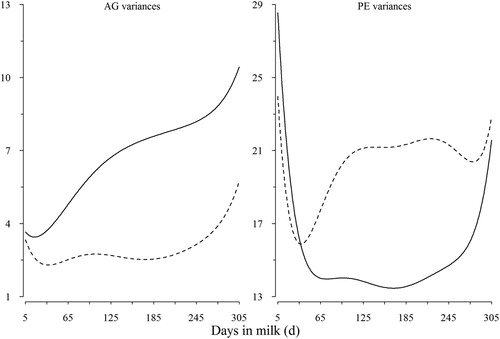
Figure 3. Heritability for milk yield (solid line) and SCS (dashed line) over DIM.
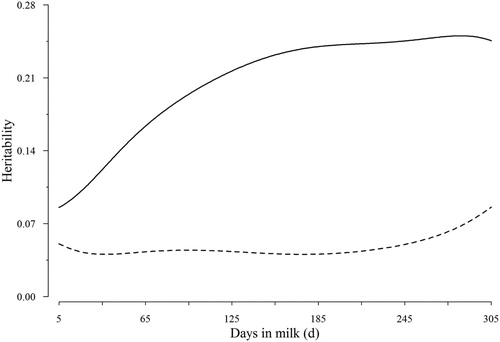
Table 3. Estimates of variance componentsa and the parameters derived from themb for complete lactation (5–305 days).
Figure 4. Additive genetic (RAG) and permanent environmental (RPE) correlations between test-day milk yield (1st column), and test-day somatic cell scores (2nd column) at different stages of lactation for the same trait.
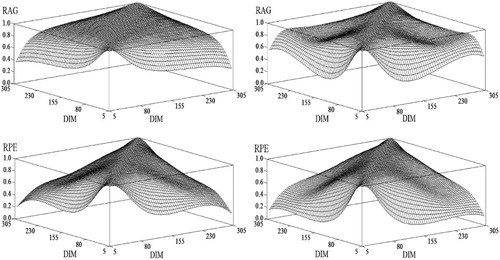
Table 4. Additive genetic and PE correlations between milk yield and SCS for different days in milk.
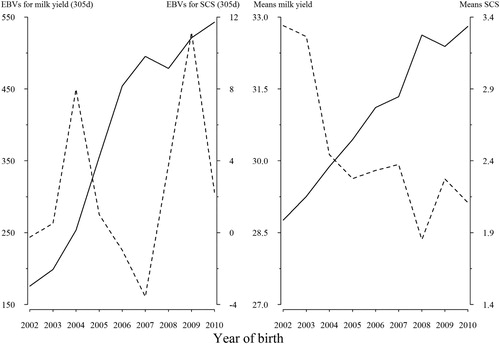
Figure 5. Estimated of genetic (left) and phenotypic (right) trends for milk yield (solid line) and SCS (dashed line) of primiparous Holstein cows in Iran.