Figures & data
Table 1. Nutrient composition of the basal diet components.
Table 2. Fermentation characteristics of the model silages.
Table 3. Nutrient composition of the test substrates.
Figure 1. Relationship between the 24 h-gas production (mL/200 mg dry matter) from maize starch (Δ), cellulose (○), as well as native peas (♦), ensiled peas (▴), native field beans (▪), and ensiled field beans (●), measured with the modified Hohenheim Gas Test (modified HGT) and the ANKOM RF Gas Production System (AGPS); regression equation: gas production (modified HGT) = 22.44416 + 0.998141 × gas production (AGPS); R2 = 0.57.
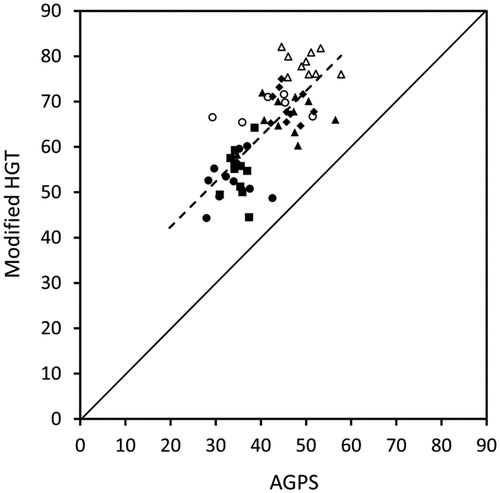
Figure 2. Cumulative gas production from maize starch (Δ), cellulose (○), as well as native peas (♦), ensiled peas (▴), native field beans (▪), and ensiled field beans (●) during 24 h of incubation, measured with the ANKOM RF Gas Production System; DM, dry matter.
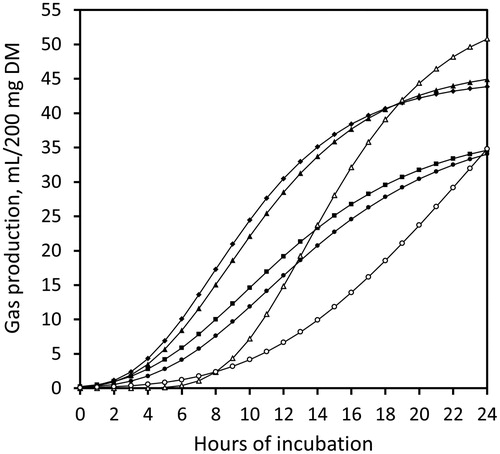
Table 4. Least squares means of 24 h-gas production (mL/200 mg dry matter) ± standard error from different test substrates measured with the modified Hohenheim Gas Test (modified HGT) and the ANKOM RF Gas Production System (AGPS).
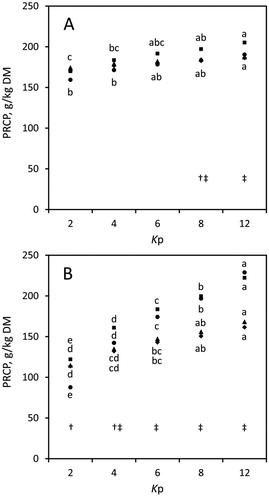
Figure 3. Concentrations of post-ruminal crude protein (PRCP) in native peas (♦), ensiled peas (▴), native field beans (▪), and ensiled field beans (●) at assumed ruminal passage rates (Kp) of 0.02 (Kp2), 0.04 (Kp4), 0.06 (Kp6), 0.08 (Kp8), and 0.12/h (Kp12), determined with (A) the modified Hohenheim Gas Test, or (B) the ANKOM RF Gas Production System; standard errors ranged between 3.16 and 14.2 g/kg DM; abcde different superscripts mark differences among Kp for same species and treatment (P < 0.05) (in A, differences only belong to field bean treatments ▪ and ●); † PRCP differed between native and ensiled field beans (P < 0.05), ‡ PRCP differed between native peas and field beans (at Kp8 and Kp12 in A, and at Kp4 to Kp12 in B), and between ensiled peas and field beans (at Kp6 to Kp12 in B) (P < 0.05), DM = dry matter.