Figures & data
Table 1. Primers sequences of PCR amplification of pigeon FABP2a gene.
Table 2. Amino acid sequences encoded by different species of FABP2 genes.
Table 3. Primers sequences of Real-time PCR.
Figure 1. Multiple sequence alignment of FABP2 amino acid sequences in the eighteen species. ‘*’ represents identical aa, ‘:’, and ‘.’ are highly and relative highly conserved aa.
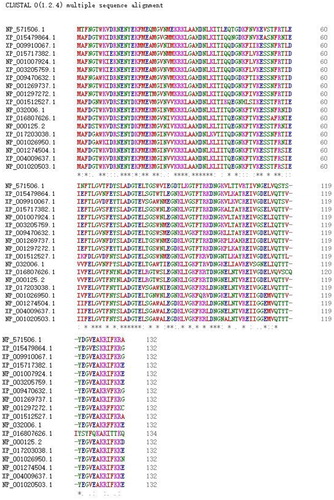
Figure 2. Phylogenetic tree draw with Neighbor-Joining method based on pigeon and the known FABP2 protein. The tree was obtained by boot strap analysis with the neighbor-joining method; number on the branches represent bootstrap values for 1000 replications.
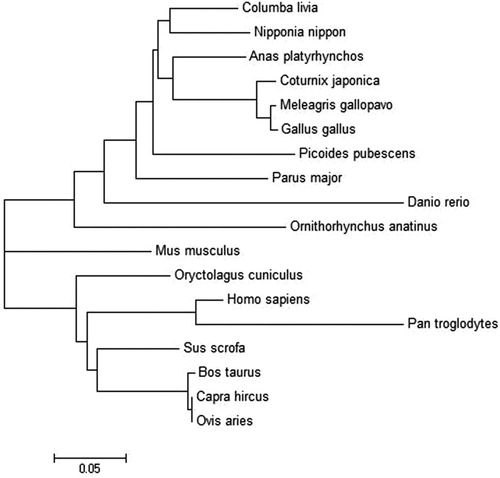
Figure 3. Amino acid sequence-based homology percent Identity matrix analysis for FABP2 and homologous proteins was created by Clustal2.
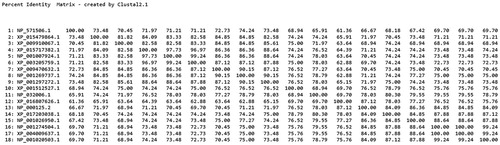
Figure 4. The tertiary structures of Fabp2. The α-helices are highlighted in purple, the β-strands in green and the coils in white.
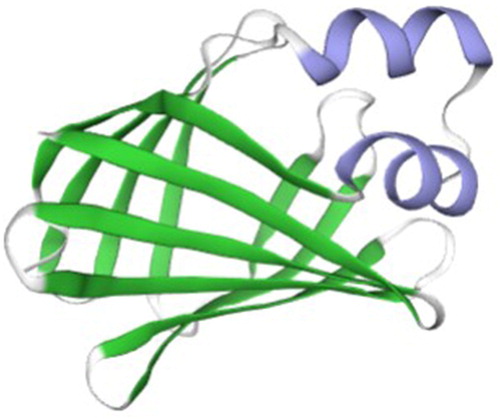
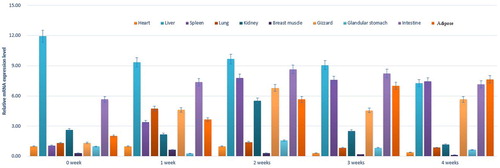
Figure 5. Relative expression levels of FABP2 in various tissues and different periods of age.