Figures & data
Figure 1. Steps in cross-validation.
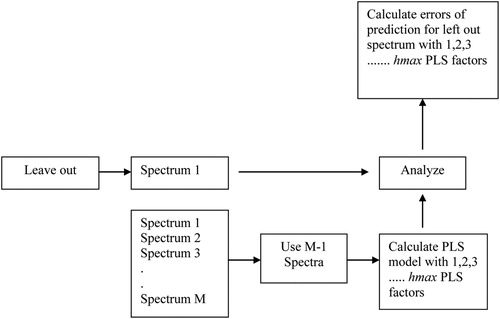
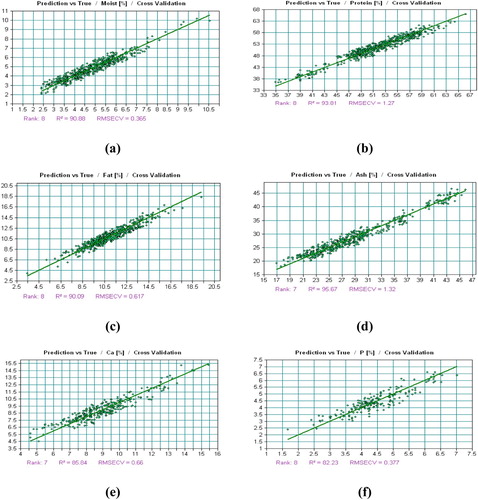
Figure 2. Prediction (NIR) vs. true (laboratory), RMSECV, PLS factors (Rank) and correlation coefficient (R2) for the prediction of (a) moisture, (b) CP, (c) EE, (d) Total ash, (e) Ca and (f) P determination in fish meal samples.
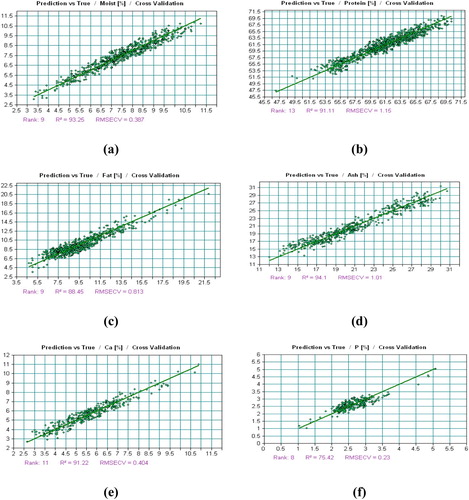
Table 1. General and calibration (NIR) statistics for the chemical composition of fish meal.
Figure 3. Prediction (NIR) vs. true (laboratory), RMSECV, PLS factors (Rank) and correlation coefficient (R2) for the prediction of (a) moisture, (b) CP, (c) EE, (d) Total ash, (e) Ca and (f) P determination in meat & bone meal samples.