Figures & data
Table 1. Experimental set-up showing the number of birds in different group(s), volume of inoculum used, route of administration and sampling time point considered.
Table 2. Criteria set for clinical sign evaluation.
Table 3. The clinical signs of infected chicken and Japanese quail inoculated with A. paragallinarum at 4 weeks of age.
Table 4. Total clinical signs score in chicken and Japanese quail at different intervals post – Av. Paragallinarum infection.
Figure 1. Development of clinical signs following experimentally induced infectious coryza (Av. paragallinarum serovar A) in birds at various days post-infection (DPI). (A) Chicken showing moderate nasal discharge (score 2) on 6 DPI (arrow); (B) Japanese quail showing mild nasal discharge on pressing (score 1) on 8 DPI (arrow); (C) Chicken showing swelling of supra-orbital sinus (star-shaped mark) along with mild nasal discharge (score 1) on 3 DPI (arrow) and (D) Japanese quail showing mild nasal discharge on pressing (score 1) on 12 DPI (arrow).
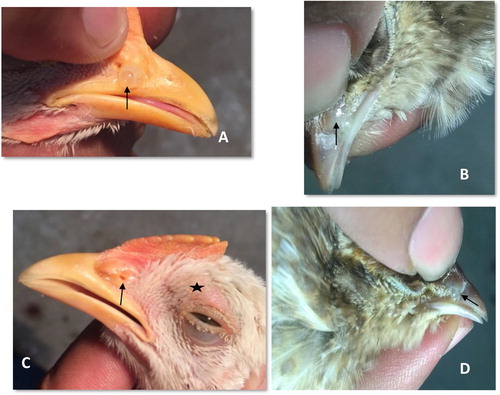
Table 5. Agglutination titre(s) in chicken and Japanese quail at 3 and 12 DPI.
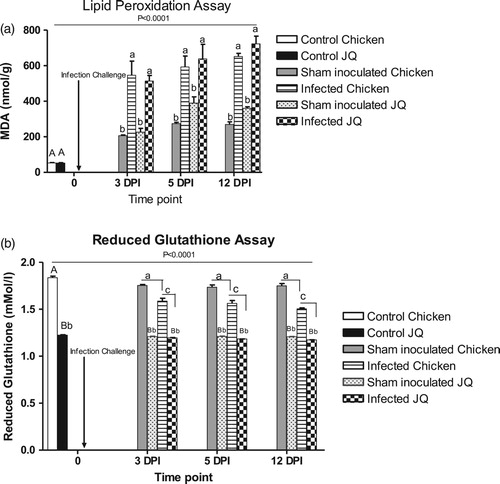
Figure 2. (A) Effects of experimentally induced infectious coryza (Av. paragallinarum serovar A) on lipid peroxidation in chicken and Japanese quail at various intervals. Each data bar represents the mean ± SEM for three birds from the indicated group. Upper case letters indicate a significant difference with respect to naïve control birds of each species; lower case letters indicate a significant difference between groups as determined by Tukey’s multiple comparison tests. The overall significant difference among groups at various time points as analysed by one way ANOVA is indicated as P < .0001. (B) Effects of experimentally induced infectious coryza infection (Av. paragallinarum serovar A) on reduced glutathione levels in chicken and Japanese quail at various intervals. Each data bar represents the mean ± SEM for three birds from the indicated group. Upper case letters indicate significant difference with respect to naïve control birds of each species. Lower case letters with different case indicate a significant difference between groups as determined by Tukey’s multiple comparison tests. The overall significant difference among groups at various time points as analysed by one way ANOVA is indicated as P < .0001.