
Figures & data
Figure 1. Collection of fecal samples from small ruminants and rabbits in Abomey-Calavi municipality.
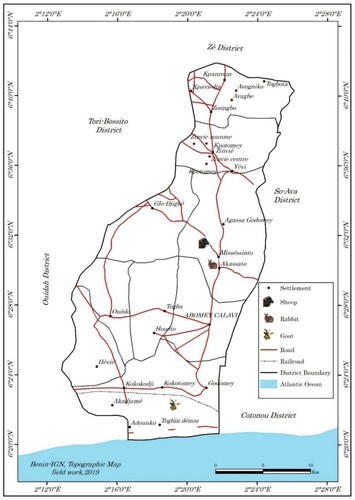
Figure 2. The Fill -FLOTAC (a) currently associated to the Mini-FLOTAC ongoing to reading under microscope (b); CREMOPAR: http://www.parassitologia.unina.it/flotac/mini-flotac/
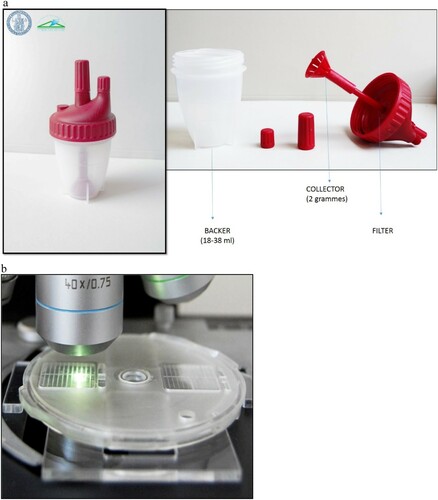
Table 1. Mean of eggs/oocysts (± ESM) and EPG/OPG (± ESM) of parasites in 40 fecal samples per animal species using two copromicroscopic techniques.
Figure 3. Prevalence of gastrointestinal parasites from goats detected by McMaster and Mini-FLOTAC techniques. Each bar of the chart represents the proportion of animals infested. The letters on each bar compare the results obtained by both techniques through the two-proportions z-test in R with the function prop.test using. Different lowercase letters indicate a significant difference between values at p < 0.05.
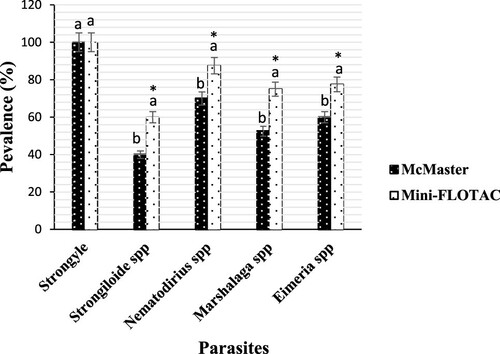
Figure 4. Prevalence of gastrointestinal parasites from sheep detected by each of McMaster and Mini-FLOTAC techniques. Each bar of the chart represents the proportion of animals infested. The letters on each bar compare the results obtained by both techniques through the two-proportions z-test in R with the function prop.test using. Different lowercase letters indicate a significant difference between values at p < 0.05.
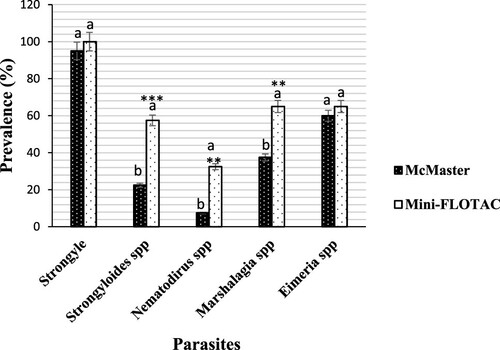
Figure 5. Prevalence of gastrointestinal parasites from rabbits detected by McMaster and Mini-FLOTAC techniques. Each bar of the chart represents the proportion of animals infested. The letters on each bar compare the results obtained by both techniques through the two-proportions z-test in R with the function prop.test using. Different lowercase letters indicate a significant difference between values at p < 0.05.
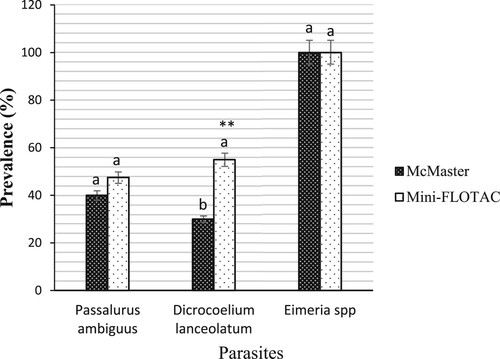
Table 2. Coefficients of variation (CV), standard deviations (SD), and precision for the two egg-counting techniques evaluated in the study.
Figure 6. Scatterplot of gastrointestinal parasites egg counts determined with McMaster and Mini-FLOTAC techniques from samples collected from naturally infected sheep.
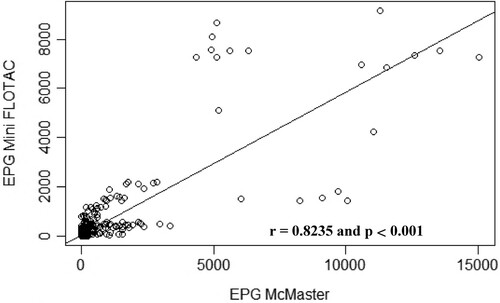
Figure 7. Scatterplot of gastrointestinal parasites egg counts determined with McMaster and Mini-FLOTAC techniques from samples collected from naturally infected goats.
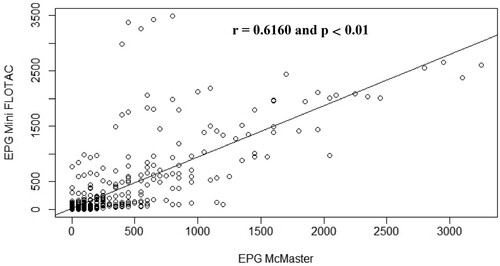
Figure 8. Scatterplot of gastrointestinal parasites egg counts determined with McMaster and Mini-FLOTAC techniques from samples collected from naturally infected rabbits.
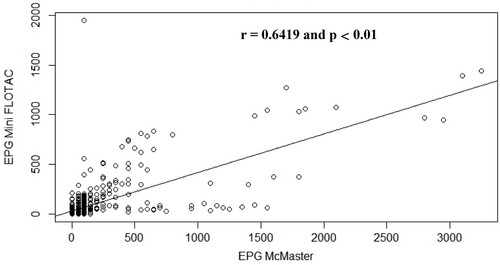
Table 3. Time taken to generate three replicate counts from 10 different sheep and rabbit fecal samples.