
Figures & data
Figure 1. Sheep of the Karachai breed.
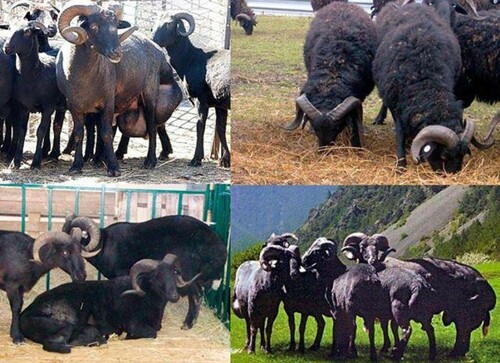
Table 1. MC4R gene locations.
Table 2. Oligonucleotide primer sequences.
Figure 2. PCR-RFLP electrophoretic analysis of the MC4R gene in Karachai sheep: AA genotype (226 bps); GG genotype (156 and 70 bps); AG genotype (226, 156, and 70 bps); Marker (100 bps).
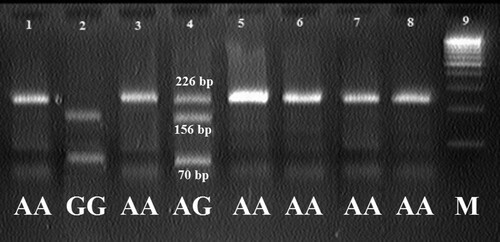
Table 3. The frequency of alleles and genotypes of the MC4R gene of Karachai sheep, n = 427.
Table 4. Observed and expected heterozygosity values of the MC4R gene of Karachai sheep.
Table 5. Growth dynamics of Karachai sheep according to MC4R genotype.
Table 6. Measured parameters of Karachai sheep that underwent controlled slaughter according to different genotypes, mean ± SEM.
Data Availability
All data generated or analysed during this study are included in this published article. The datasets used and analysed during the current study are available from the corresponding author on reasonable request