Figures & data
Table 1. Primers for cloning and RNA quantitative assay.
Figure 1. Food intake (top) and body weight (bottom) of rats injected with 5-aminoimidazole-4-carboxamide-1-β-d-ribofuranoside (AICAR). The final data points represent final values the day before killing. n = 13 rats per group.
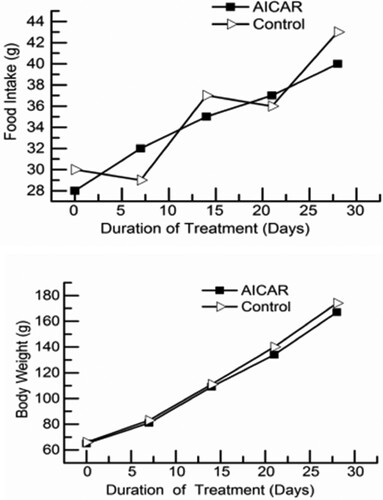
Figure 2. Changes in AMPK and ACC phosphorylation in GS muscle from control and AICAR Wistar rats. (A) Representative blots made by using antibody against. (B) Average values for the protein expression. n = 13 muscles per group.
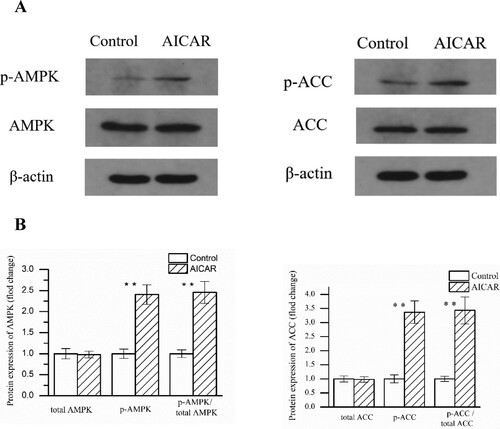
Figure 3. Representative photomicrographs of the GS in control group (A) and AICAR group (B). Cross-sections of GS muscle stained for myosin ATPase after pre-incubation in pH 4.60–4.65. Magnification of 200× was used (bar = 200 μm). I: fiber type I, black; IIA: fiber type IIA, white; IIB: fiber type IIB, brownness. n = 13 muscles per group.
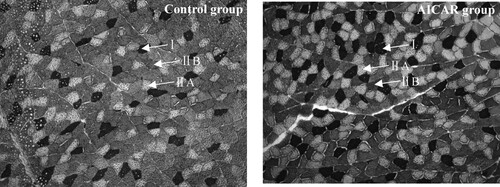
Table 2. Effect of AICAR treatment on muscle fiber characteristics of Wistar rats
Figure 4. Changes in myosin heavy chain (MyHC) isoform mRNA level in GS muscle from control and AICAR Wistar rats. n = 13 muscles per group.
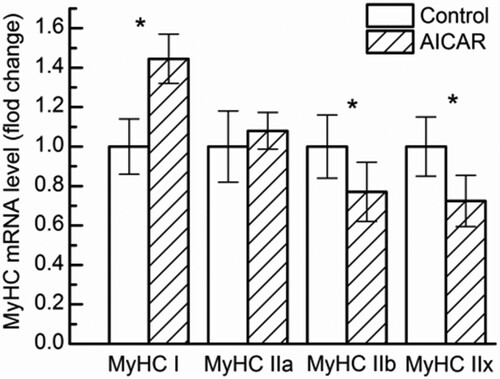
Figure 5. Changes in enzyme activity (succinic dehydrogenase (SDH), malate dehydrogenase (MDH), lactate dehydrogenase (LDH)) in GS muscle from control and AICAR Wistar rats. n = 13 muscles per group.
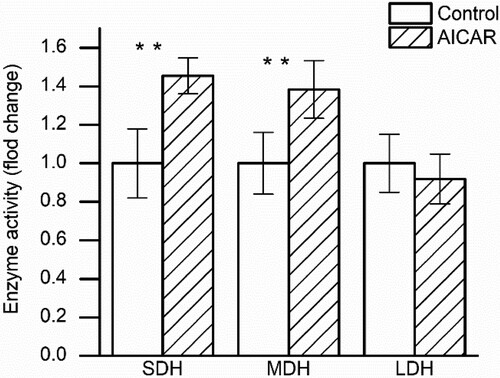
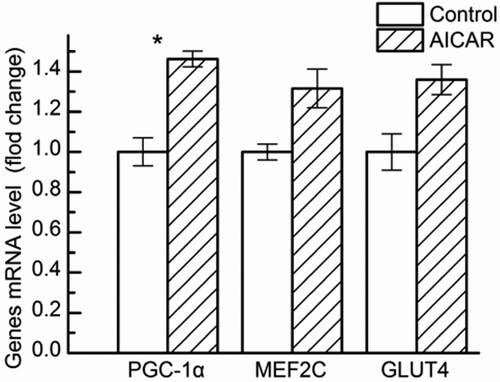
Figure 6. Changes in Peroxisome proliferator-activated receptor-γ coactivator-1α (PGC-1α), glucose transporter 4 (GLUT-4), Myocyte enhancer factor 2C (MEF2C) mRNA level in GS muscle from control and AICAR Wistar rats. n = 13 muscles per group.